You purchase a new IT device, and enter the purchase cost into the system. A few months later, you realize this asset is incurring a lot of hidden costs that you did not predict. So, where did you go wrong?
If your asset cost is only what you paid for it, you’re missing 70% of the picture. The problem is that most IT managers track the initial cost at point-of-purchase, but overlook what happens after acquisition. Incomplete information regarding asset cost can lead to surprise expenses that eventually drain your budget.
Cost visibility is your ultimate superpower to deal with increasing hardware costs and generate ROI-based reports to justify IT spending. Tracking TCO (total cost of ownership) can help prevent last-minute budget leaks.
By definition, TCO is the complete cost of acquiring, using, maintaining, and retiring an asset, in this case, IT asset throughout its entire lifecycle. Accurate cost estimates give you complete visibility into capital expenditures, turning reactive IT spending into strategic cost control.
What IT Asset costs actually include
Getting IT devices at a great deal might actually be taking you down. If you have been considering just the purchase cost until now, it’s time to start documenting other critical costs.
1. Capital Expenditure (CapEx)
CapEx is the upfront cost to acquire an asset, and is usually incurred only once. It includes the following:
- Purchase price of the asset (laptop, server, router, etc.)
- Taxes and local levies
- Setup or configuration fees
- Shipping and freight
- Import duties or tariffs (especially for international purchases)
Scenario: You order 50 laptops for a new team. While the invoice says $50,000, the total hits $62,000 after VAT, import duties, shipping, and setup costs. If your budget was based solely on sticker price, you’re already over.
You’re making a mistake if you don’t account for CapEx for all your assets. The asset management systems only record list prices, which are consulted to generate budgets.
The impact?
- You exceeded your CapEx budget unexpectedly.
- You end up justifying the extra costs to the CFO.
- You get fewer procurement approvals due to a limited budget.
2. Operational cost (OpEx)
These are calculated as the ongoing expenses for each IT asset and include the following:
- Preventive maintenance and break-fix/repairs
- Hardware or firmware upgrades
- Ongoing software licensing (for OS, antivirus, or productivity tools)
- Cloud subscriptions tied to the asset (e.g., for MDM, storage, or security tools)
Scenario: That new set of laptops needs annual antivirus renewal ($40 per device), cloud backup subscriptions ($10/month), and a few RAM upgrades mid-year. Suddenly, each “$1,000 laptop” costs much more over time.
It’s very easy to miss out on these routine expenses as they are spread across departments or buried in subscription billing forms.
The impact? Budget leaks due to unused subscription plans and there’s no clear estimate of the total cost of ownership of an asset over time.

3. Human costs
These are the time and effort involved by your team members in getting your IT assets up and running. You will often find your employees working on:
- Time spent on deployment, imaging, and provisioning
- Helpdesk support for asset-related issues
- Troubleshooting, reassignments, patching, and updates
Scenario: Each new device takes approximately 1.5 hours to set up (e.g. installing apps, configuring settings, testing). For 100 devices, that’s 150 IT hours — almost a month of full-time work, without counting ongoing support.
Manual effort and support are not always documented formally.
The impact?
- The IT team bandwidth is being stretched thin, without visibility into where most of their time is spent
- Unexpected project delays due to ad hoc support workflows
- C-level executives often underestimate the staffing needs
4. Lifecycle logistics
These are mainly costs related to moving, repurposing, and retiring the asset:
- Device retrieval during offboarding or reassignments
- Warranty extensions
- Decommissioning, recycling, or running a secure data wipe
- Temporary replacements during breakdowns
Scenario: An employee leaves unexpectedly, without returning their laptop. You send someone to retrieve it, wipe the data, and ship it to another office. Add courier charges, labor time, and a few days of lost use, this “handoff” costs more than you’d think.
Logistical tasks such as device retrieval, reassignment often happen informally without being tracked in a system.
The impact?
- Lost items or misplaced items due to delayed returns
- Data-bearing devices may not be wiped properly, creating a risk
- Warranty expirations get missed, leading to out-of-pocket repair costs
5. Cost of non-visibility
Poor data quality due to lack of a centralized asset management system to track TCO also leads to extra cost. These indirect but damaging costs often include:
- Paying for unused software licenses or underutilized hardware
- Compliance penalties from outdated or non-secure devices
- Data breaches due to lost assets
Scenario: You forget to cancel a $300/month software license for a former employee due to a lack of onboarding alerts. It renews for 6 months before someone notices. That’s $1,800 wasted, leading to SaaS license waste for your company. Worse, the unused account could still have access to sensitive systems.
Without a formal system to track important asset details, it’s common to miss out on license renewals, ownership changes, and usage metrics.
The impact? Overspending due to miscalculation of costs and asset losses, leading to security risks.
Why IT Teams struggle to see the full picture
The costs associated with an IT asset don’t really stop once it’s bought; they just get harder to track. Additional costs are scattered across systems, commonly not linked with a central platform, making it challenging to account for TCO throughout an asset’s lifecycle.
Let’s look at a few reasons why you may be struggling to get complete cost visibility:
1. Cost data lives in silos
You’re tracking asset related costs in several different systems instead of one, without knowing the repercussions. CapEx is entered in an ERP system which contains all solid costs, while on-premise and cloud software licenses are stored in a spreadsheet.
For instance, for a Macbook you may have stored its purchase cost and maintenance charges in the ERP, while all associated help desk tickets reside in Zendesk and there is no way to connect the two. The result? Fragmented cost calculations.
2. Costs aren’t tied to individual assets
Even if you are recording CapEx, OpEx, and logistical costs, there is a slim chance that you know which asset is tied to all these costs. Most organizations track how many licenses they’ve purchased, not who they’re assigned to, how often they’re used, or what devices they’re linked with.
It’s the same with hardware: you may know you bought 50 laptops, but not how much ongoing support time each device is consuming, or whether some are chronically underperforming and eating into IT hours.
3. No one owns the total cost of ownership (TCO) responsibility
Your day goes by deploying IT assets for users, chasing devices for remote employees, and justifying budgets for replacements. During all this, you don’t get time to compile the total cost of ownership (TCO of running IT assets deployed across the organization.
Then who does it? Most of the time, no single team or department is in charge of all these costs. Since all these costs are scattered within different systems, there is no single KPI to optimize lifecycle costs.
The result? You are left making decisions with only 30% of an asset’s financial visibility, while the remaining 70% has no ownership.
4. No easy way to report cost trends
Your costs are all stored in disconnected systems without any link to the central asset. Without access to TCO, you’re missing half of the picture. Cost reports aren’t accurate because the data source isn’t reliable.
You keep generating reports, but they fail to predict how much an asset is actually going to cost in the next quarter. The reason? You don’t have access to the right data.
Budget trends don’t work out, always falling short or sometimes going over. Gathering data requires a lot of effort, even then, it’s scattered and unstructured.
The risks of not knowing your true asset costs
Without complete visibility into the asset lifecycle costs, it becomes difficult to make accurate decisions for budgets. Every year, you have no explanation for missed financial targets, and you are still hoping for a way to cut costs this year.
Here’s how the risks of not knowing your costs play out in action and why they need urgent attention:
1. Overbuying: Unused inventory piling up
Without a central system to process inventory requests, there is no way to track what’s in stock and what’s consumed. Not knowing how much to order and when to order can very easily lead to duplicate purchases, piling up unused inventory of IT devices.
Different departments make overlapping requests which get fulfilled by IT, leading to double buying of assets that sit unused in the warehouse. This drains your CapEx account, and clutters inventory and complicates audits.
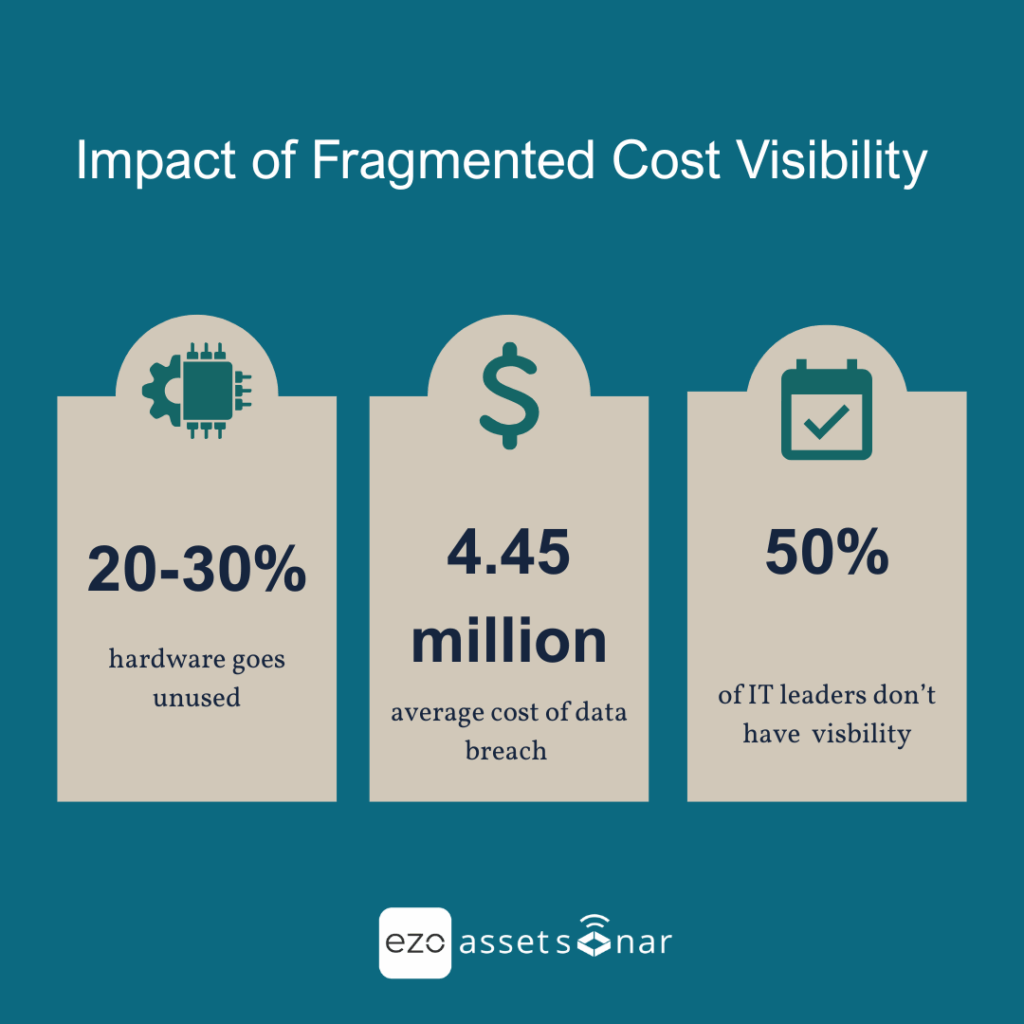
In fact, Flexara estimates that 20–30% of IT hardware purchased by enterprises goes unused.
2. Budget waste: Renewals on autopilot
Since software costs are not linked to actual users, just the software itself, the subscriptions keep getting renewed. There are no regular reviews or alerts when a license seat needs to be cancelled, so you end up overspending money that could have been used elsewhere.
Gartner reports that organizations overspend by as much as 25% on software due to poor license management.
3. Security risks: Growing count of orphaned devices
When an employee leaves, devices often are not returned since there are no offboarding protocols in place. In some cases, these devices may stay connected to your network putting sensitive data at a security risk.
According to IBM, the average cost of a data breach in 2023 was $4.45 million, often initiated through unsecured endpoints.

4. Poor forecasting: Your data is not reliable
If there is no way to tell how long assets are lasting or what they’re costing you, there is no proper way to plan procurement cycles. The data you own isn’t reliable, as it’s retrieved from disconnected systems and does not convey the whole picture.
Due to these reasons, your case is not nearly as strong to satisfy the finance department. All these factors lead to reactive spending, budget shocks, and poor procurement practices.
53% of IT leaders say they struggle to get complete visibility into IT assets (and their costs) due to fragmented data, siloed teams, and systems.
5. Missed optimization: Not getting the asset’s full worth
When you closely track the entire lifecycle of an asset you are able to identify areas of potential improvement through increased productivity, higher performance and even lower downtime.
You can only determine optimization points when you have clear visibility into how much maintenance an asset undergoes, how often it needs to be restocked, and how many people are currently using it.
Example: Overinvesting in laptops that underperform
A mid-sized company rolls out 300 high-end laptops for its engineering team, assuming that more expensive devices will ensure better productivity and longevity. Each unit costs $2,000. Over the next 18 months, IT noticed an increase in support tickets related to overheating, slow performance under heavy workloads, and battery issues.
As the company lacks a system to track asset performance and support history by laptop model, this pattern goes unnoticed. They continue to reorder the same model during the next procurement cycle.
What they missed:
- The marketing team used a less expensive, business-grade alternative ($1,400/unit) that had significantly fewer support issues and better uptime.
- If they tracked incident data and asset usage patterns, they could have switched models, saving ~$180,000 over two procurement cycles plus reduced downtime for engineers.
How to start gaining cost visibility (Without changing everything overnight)
Getting complete control over IT costs involves a bit of effort and organization to get the tools working for you. You don’t necessarily need complicated and expensive systems; just learn how to use the existing ones.
Below is a step-by-step guide on how to start gaining cost visibility for IT assets in your organization:
Step 1: Tag all assets with owners and departments
Your assets can’t be associated with costs if they aren’t labelled properly. To create unique IDs for all your assets, you can use IT asset management software. Such a system stores all of your data related to assets, lets you categorize items by users, and departments.
For best results, tag IT assets as soon as they are procured and link them to locations, and add lifecycle stages.
Step 2: Track cost events, not just assets
You have a list of critical metrics that you regularly track for all of your assets: serial numbers, purchase dates, and assigned users. But that’s not enough. Real cost visibility comes when you start to track cost events throughout the asset lifecycle.
These usually go undocumented, so here’s a list of cost events to keep track of:
- Setup time: This includes provisioning, imaging, configuring, and installing software. Adding up to an average of 1-2 hours of IT labor per asset. Multiply that across dozens or hundreds of devices — it adds up fast.
- Support tickets and troubleshooting: Log all helpdesk calls, track their frequency and tie all related costs back to assets to figure out high-maintenance devices.
- Repairs and replacements: Any out-of-warranty repairs, replacement parts, and accidental damage needs to be noted down.
- License renewals and subscription plans: Tie license renewals and subscriptions to specific assets. Enter any upgrades to higher-tier plans or add-on features acquired over time.
Step 3: Centralize cost data across systems
The biggest threat to cost optimization is disconnected systems. Connect helpdesk, procurement, SaaS, and ERP where possible. Integrate with procurement systems to stay on top of CapEx.
Start logging installation costs and other IT manual labor in a helpdesk system and integrate with the main asset tracking software. Basically make sure all critical tools that record costs are connected with each other, giving complete visibility into TCO.
Step 4: Benchmark across asset classes
After setting up a system to track TCO, start using it to get tangible results. When you have complete access to what an asset is costing you, it becomes easier to calculate its rate of return on investment (ROI).
Example: Benchmarking network switches
Your IT team supports multiple office locations, each equipped with different network switches — some are enterprise-grade Cisco models, others are mid-range Netgear units.
After six months of tracking Total Cost of Ownership (TCO) per device, you discover the following:
- The Cisco switches cost $4,000 upfront but have zero support tickets, minimal setup time, and seamless firmware updates.
- The Netgear switches, on the other hand, cost only $1,200, but they’ve triggered 15 helpdesk tickets related to dropouts and reboots, required frequent patching, and need manual configuration changes after every firmware update.
Once you include IT labor, downtime costs, and user complaints, the cheaper switches end up costing 40% more over the same period — not just in dollars, but in IT hours and lost productivity.
What cost visibility enables
Cost visibility into your IT ops can put you in control of what’s actually happening with your assets. Start collecting the right data to improve cost transparency across the org.
Let’s look at some prominent ways cost visibility can help you:
1. Identifying true TCO by device type : Smarter procurement
You can launch a smart cost management strategy by documenting granular asset details to spot inefficiencies. An asset that costs less may end up incurring a higher maintenance expense as compared to a relatively expensive machine. All this data can help procurement teams make data-driven decisions to support long-term growth.
2. Justify IT spend with ROI evidence to Finance/Execs
Get rid of the last-minute stress of not having any justifications or alternative plans for growing costs. Know which assets are costing you more, and have a plan for the next best alternative. Transform your data reporting into a powerful tool for strategic investment in the right tools.
3. Enable chargebacks or showbacks by department or user group
Cost visibility for each asset by user, device, and group helps organizations drive accountability. Showback reports help you determine where most of your budget is being spent and how you can allocate the remaining money to get better performance.
IT teams can even file for chargebacks to account for the extra hours spent on the department’s assets.
4. Improve refresh and replacement timing
Move from a fixed schedule to a data-driven lifecycle approach. Track asset age, usage patterns, and warranty status to identify when a device is costing more to maintain than replace.
Segment assets by criticality and refresh in tiers, prioritizing high-use devices while repurposing low-use ones. Use dashboards to share aging and risk reports with Finance and Procurement, aligning refresh plans with budgets. This proactive strategy can help reduce downtime, avoid surprise costs, and extend the value of every asset.
5. Correlate support tickets or SLA data with asset type/age
Compiling help desk tickets or SLA breaches against an asset can provide a clear picture of the overall performance. Rising incident volume over time means you probably need to look at alternate maintenance practices and make a decision to retire or upgrade a device.
6. Track and reduce unnecessary SaaS/renewal costs
Without true insights into IT device health, you cannot estimate the accurate number of licenses getting approved in the organization. 50% of the license renewals may be sitting idle, adding up renewal costs every year. TCO associated with relevant users and departments helps you identify inactive licenses to cut costs and optimize software usage.
Conclusion: If you don’t know the cost, you can’t prove the value
Running IT operations without taking into account the entire asset lifecycle is going to cost you a lot more than you think. Rising tariffs, hardware prices, and increased executive scrutiny is only going to make your job harder. Lack of cost visibility not only puts you in a financial crunch but also prevents you from achieving business value.
On the flip side, it’s not as dark as it sounds. You don’t need perfection, but you do need progress. Even 30% more cost visibility can reshape decisions. Centralized asset tracking, along with continuously logged IT support, and renewal and license usage optimization can give you more control on where you spend most of your IT budget.
Greater visibility into your IT budgets can drive smarter decision making, saving costs along the way. Forecast better while analyzing spend history to drive procurement decisions. Allocate resources not based on the tag price but the actual value added to your business. Start where you are! Tag and document all assets in an IT asset management solution and sync across the systems to give you that first boost of visibility!
Want to see what full asset cost visibility looks like?
Try our IT Asset TCO Tracker Template and get started today.
Frequently Asked Questions
What factors determine the total cost of ownership (TCO) for an IT asset?
The TCO includes purchase price, deployment/setup, maintenance, support, depreciation, upgrade/refresh costs, licensing/subscriptions, and end-of-life disposal.
How do I calculate depreciation for IT assets?
Depreciation = (Original Cost − Salvage Value) ÷ Useful Life. Use straight-line or accelerated methods depending on accounting policy. AssetSonar can help track these values.
How do licensing and subscription costs impact overall IT asset cost?
They often add recurring OPEX. Hidden fees (renewals, feature tiers) and under-used licenses can inflate cost if not monitored.
What are “hidden costs” when purchasing IT assets?
Hidden costs include storage, training, energy/power, software compatibility, warranty, support, downtime, and disposal.
How do maintenance and support contracts affect asset cost?
Poor maintenance = more downtime and repair costs. Good support contracts increase uptime but add recurring cost. Balanced maintenance contracts reduce overall lifecycle cost.
Should I expense or capitalize IT asset purchases?
Expense small-value items and routine replacements. Capitalize high-cost assets (based on your accounting threshold) to reflect long-term value and depreciation.
How often should IT assets be refreshed or replaced?
Depends on wear, obsolescence, vendor support, performance needs. Common practice: hardware every 3-5 years; software when versions are no longer supported.
How do scale and volume affect the cost per IT asset?
Buying in volume gives better rates for hardware, warranties, support. Larger fleets benefit from economies of scale in maintenance and license discounts.
What cost savings come from better utilization of IT assets?
Savings from reallocating under-used assets, avoiding over-purchasing, reducing idle inventory. Proper usage tracking via tools like AssetSonar helps.
How do you budget for the lifecycle cost of IT assets?
Plan from acquisition through disposal. Include procurement, deployment, upgrades, maintenance, security, depreciation, and disposal in the budget forecast.
What is the impact of warranty and support life on asset cost?
Longer warranties or good support reduce unexpected repair/replacement costs and downtime, though they add upfront cost. Evaluate cost-benefit.
How do location, shipping, installation affect asset cost?
Remote locations or special installation needs can increase costs of shipping, taxes, labor. Plan for logistics in total cost estimation.
What metrics should I track to monitor IT asset cost over time?
Useful metrics: cost per asset, cost per user, maintenance cost vs asset value, depreciation schedule, downtime cost, utilization rate.
How do you compare the cost of on-premises vs cloud or SaaS alternatives?
On-premises has upfront capital, hardware, maintenance. Cloud/SaaS shifts cost to subscription, scaling, possibly higher recurring fees. Compare based on usage, scale, security needs.
How do regulatory compliance, security, and audits add to asset cost?
Non-compliance may incur fines or remediation. Security patches, monitoring, data protection costs add overhead. Tracking via AssetSonar helps minimize these risks.
Can automation reduce IT asset cost? If yes, how?
Yes. Automation (inventory discovery, offboarding, license reclaiming, alerts) reduces manual effort, errors, over-spend. Tools like AssetSonar can automate many routines.
How do repair vs replace decisions affect cost management?
Compare cost of repair + downtime vs cost of purchasing new. If repair cost is near replacement and asset is aged or inefficient, replacement often better.
How much of asset cost is due to energy and power consumption?
For devices always on (servers, network gear), energy is a significant portion over time. Energy-efficient gear and sleep/idle policies help reduce power costs.
What is the impact of asset disposal or end-of-life on costs?
Disposal costs (data wiping, recycling), residual value or salvage, regulatory disposal requirements all add cost. Accounting for EOL helps avoid surprises.
How to forecast future asset costs during budgeting?
Use historical spend data, growth planning, tech refresh cycles, vendor price trends. Tools with cost forecasting & reporting (like AssetSonar) aid accurate forecasts.