![How-to]-Track-On-Prem-Software-Usage-and-Uncover-Shadow-IT](https://cdn.ezo.io/wp-content/uploads/2025/07/15110912/How-to-Track-On-Prem-Software-Usage-and-Uncover-Shadow-IT-1024x512.jpg)
Struggling to figure out which software is being used across your organization’s devices? With AssetSonar’s Software Usage Metering, you can stop guessing and start knowing. This feature provides you with direct visibility into software activity on your devices, enabling you to uncover unused licenses, identify unauthorized software, and take control of Shadow IT.
Note: This beta release is currently available for Windows and macOS devices only. Use the guide below to deploy software usage metering to a single device for testing or small-scale use. For mass deployment, please contact us at support@ezo.io.
1. Enable Software Usage Metering
To turn on software usage tracking:
- Go to Settings → Software → Software Usage Metering (Beta).
- Select Enabled and click Update.
You can then select the relevant option you want enabled:
- Installed Software Tracking: Brings usage information for on-prem software.
- Browser Tracking: Fetches accessed URLs on Chrome browsers.
- Domains Blocking: Blocks the specified domains on your managed Chrome browsers.
To know more about Browser Tracking and Domain Blocking functions of AssetSonar, go here.

2. Install Required Tools
To begin capturing software usage data, you need the following:
- AssetSonar ITAM Agent. You can find the complete details on deploying AssetSonar ITAM Agent here.
- AssetSonar Activity Tracker
You can find the installation links for both under Settings → Software → Software Usage Metering (Beta).
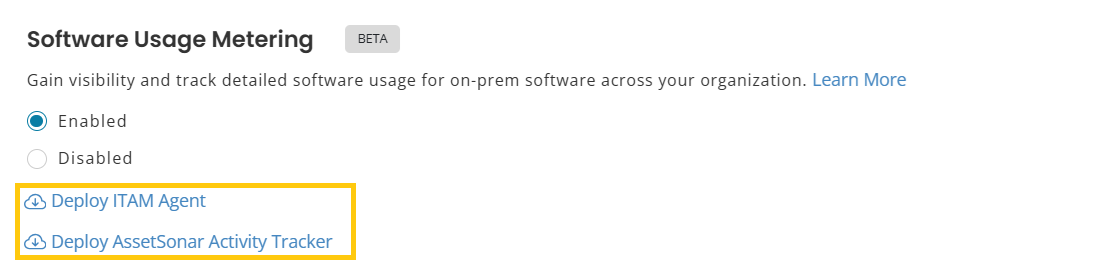
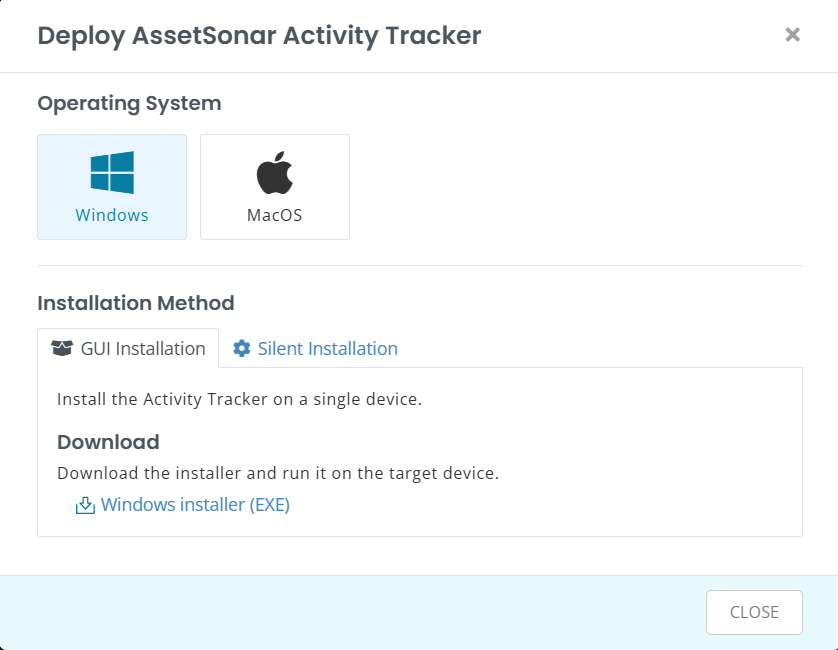
To install AssetSonar Activity Tracker, click on the Deploy AssetSonar Activity Tracker. You will be displayed a pop-up where you may select the relevant OS and whether you want to deploy on your own device (GUI Installation) or silently deploy it to other devices. You may reach out to us at support@ezo.io for additional help.
Once you have enabled the settings and installed both the tools, AssetSonar will start collecting usage insights.
3. Get a High-Level View of Software Usage (Software Overview Tab)
Once Software Usage Metering is enabled and usage data begins to flow in, the Software Overview tab becomes the default landing page for the Software module. This view gives you a centralized, usage-focused snapshot of software activity across your organization.
To access it, go to Software (Navigation Menu) → Software. You’ll land directly on the Overview tab.
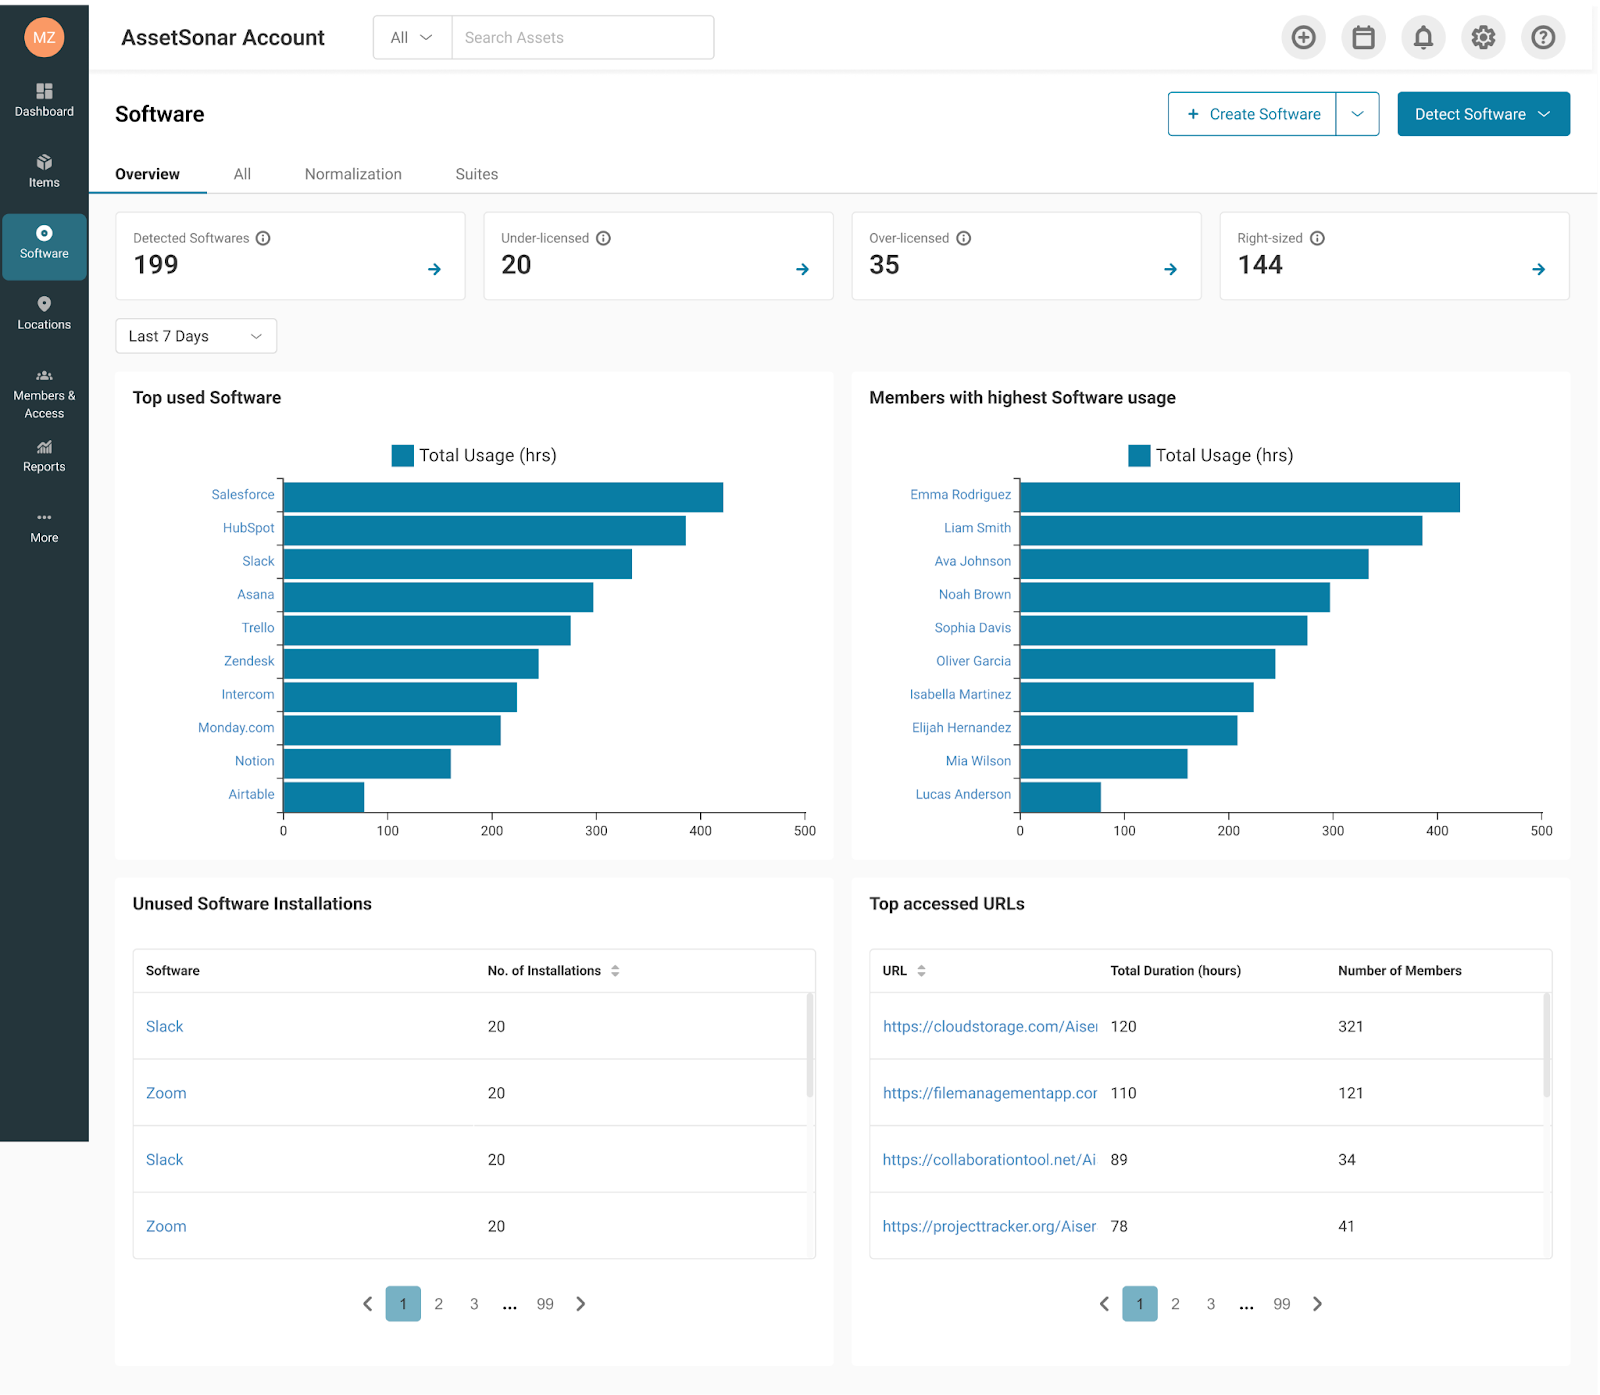
From here, you can quickly understand:
- Which software is being used the most across the organization.
- Which members account for the highest overall software usage.
- Which software installations remain unused within a selected time range.
- Which URLs are accessed most frequently through browsers.
The Software Overview tab aggregates detected usage duration across assets and members, helping you identify usage patterns, potential shadow IT, and optimization opportunities before drilling into individual software or devices.
4. View Software Usage of an Asset
Once everything is set up, AssetSonar begins collecting usage data automatically.
Note: It may take up to one hour for the initial sync to complete and for usage data to appear, depending on device activity and network conditions.
To view software activity on a specific asset:
- Go to Items → Assets and open the relevant asset’s Details Page.
- Click the Software tab.
You’ll see the list of Discovered Software for that asset, providing you with the information on the Name, Version, Publisher, Installation Date, and Last Access Date. Use this view to spot unused software on individual devices, ideal for 1:1 investigations or cleanups.
5. Get the Full Picture: Devices, Users, and License Insights
Once software usage is detected, AssetSonar ties together insights from devices, users, and licenses, all from the Software’s details page.
Navigate to Items → Software and open any software to explore:
- Associated Assets tab
View all devices on which this software has been installed, including when each last accessed it. - Associated Users tab
See who accessed the software, whether on-prem or via cloud. You’ll also see their license status and last activity timestamp. - Associated Software Licenses tab
If the software is licensed, go to the Associated Software Licenses tab and click on a license. You’ll land on the License’s details page, where you can view a consolidated breakdown of cloud and on-prem usage from the User Insights tab. Similarly, on the Installation Insights tab, you may find installations that are licensed or unlicensed.
In case any installations are unlicensed, you may entitle them directly from here.
6. Visualize Usage Trends with Widgets and KPIs
Once software usage tracking is enabled, AssetSonar provides actionable insights through dedicated KPI cards and usage widgets across your workspace.
These visualizations help you quickly identify:
- Most used and least used software.
- Users or assets with high or low software engagement.
- Shadow IT risk via cloud and on-prem access.
- Optimization opportunities based on actual usage.
These insights help CIOs and IT leadership make smarter renewal, budgeting, and compliance decisions at scale.
You’ll find these KPIs in three main areas:
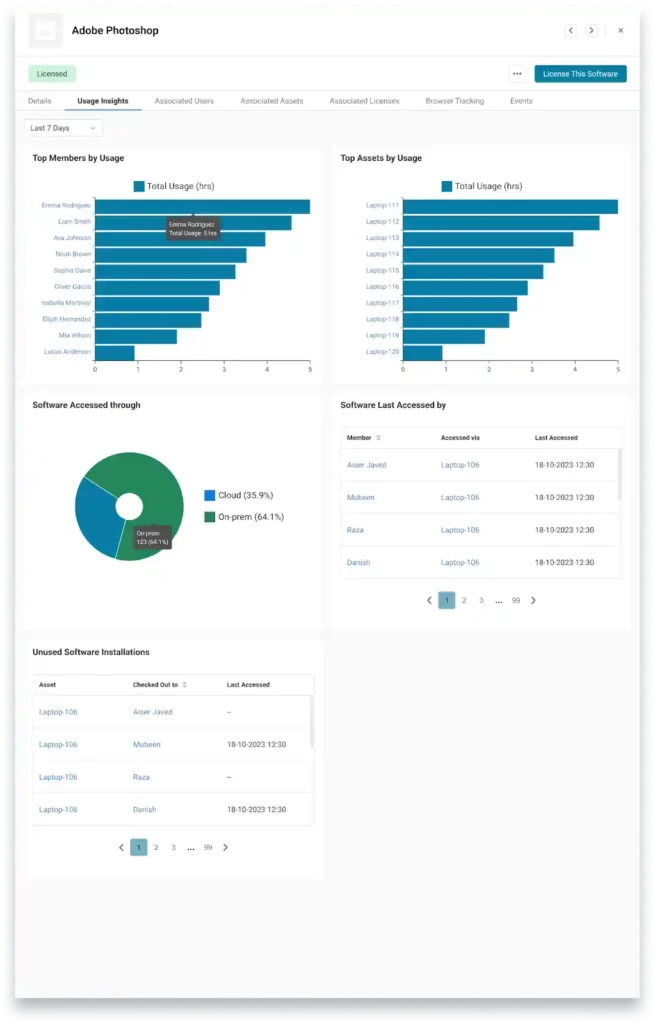
A. Software Details Page → Usage Insights Tab
Go to Software (Navigation Menu) → Software Name → Usage Insights to view:
- Top Members by Usage – Bar graph of users who used the software the most.
- Top Assets by Usage – Bar graph of devices with the highest usage.
- Software Accessed Through – Donut chart breaking down cloud vs on-prem access.
- Software Last Accessed By – Table of users with timestamps and devices.
- Unused Software Installs – Devices where this software is installed but unused.
Use the date range filter to adjust the timeframe of these insights.
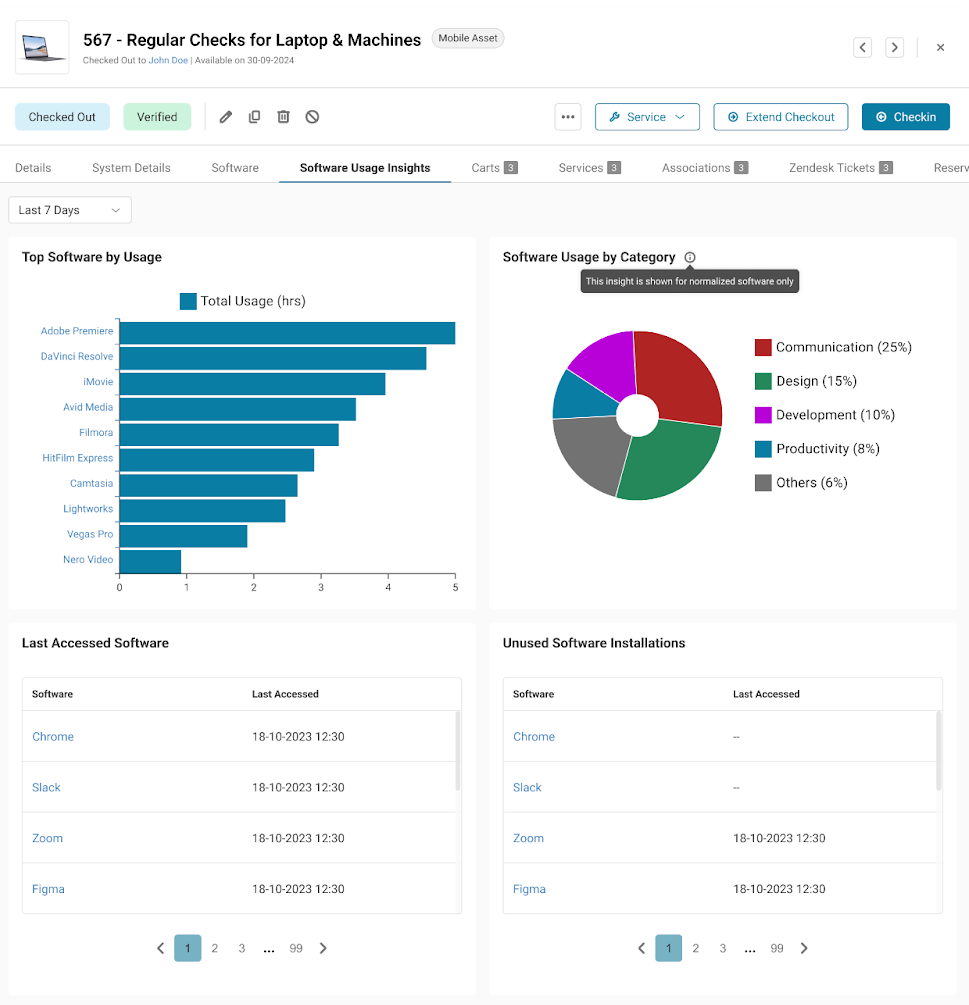
B. Asset Details Page → Software Usage Insights Tab
Go to Items (Navigation Menu) → Assets → Asset Name → Software Usage Insights to see:
- Top Software by Usage – Most used software on the device.
- Software Usage by Category – Donut chart showing the category of each software (e.g., Design tool, Productivity tool, Development tool).
Note: This insight is available only for software that has been normalized. To normalize software, go to Software → Normalization.
- Total Software Usage Time – KPI card aggregating usage duration.
- Last Accessed Software – Table of recently used software.
- Unused Software Installations – Installed apps not used during the selected period
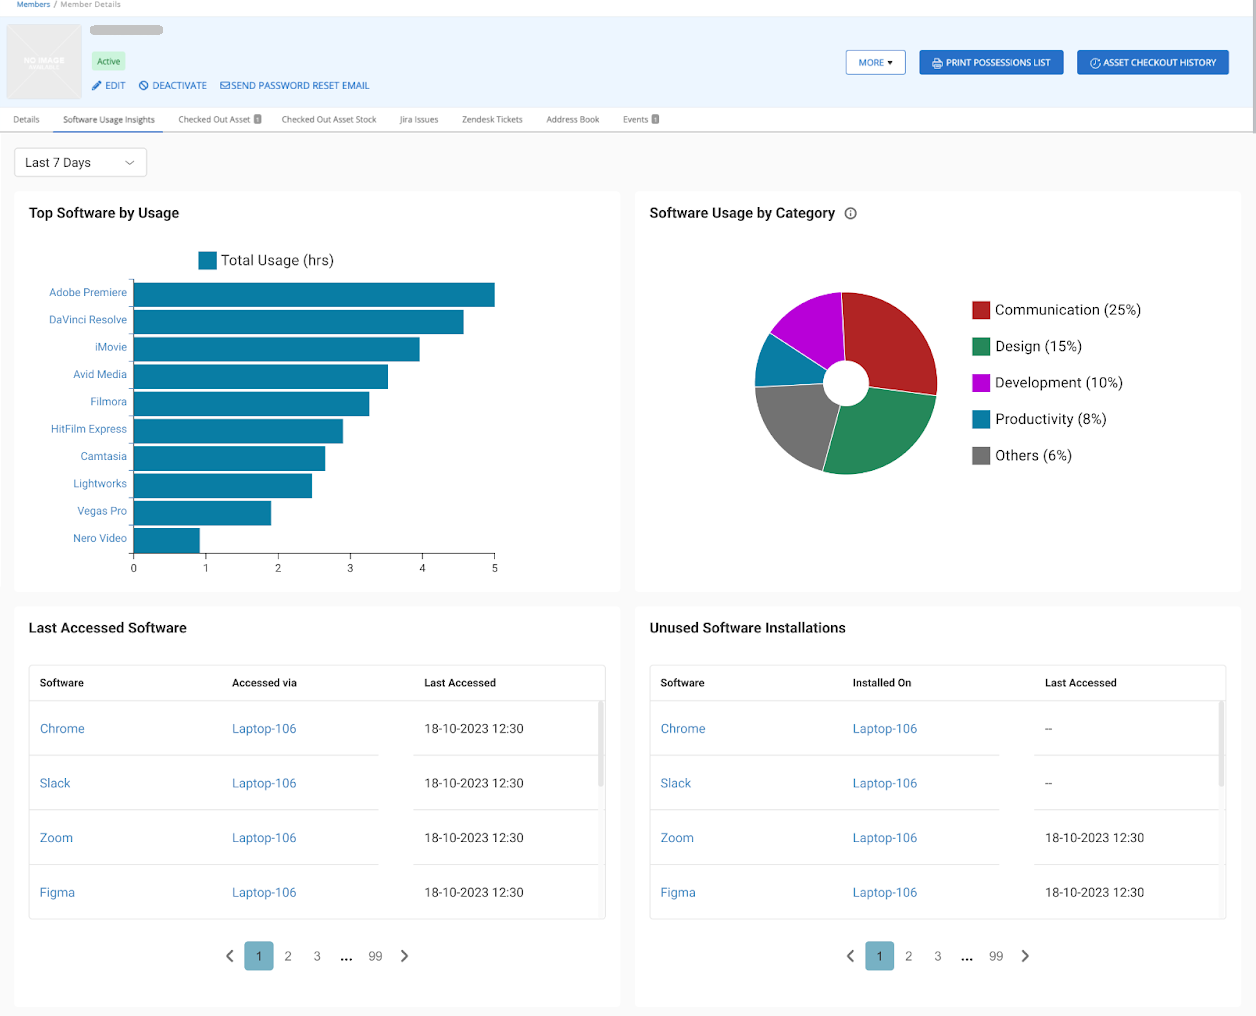
C. Member Details Page → Software Usage Insights Tab
Open Members & Access → Member Name → Software Usage Insights to explore:
- Top Software by Usage – Software used most by this person
- Software Usage by Category – Donut chart showing the category of each software (e.g., Design tool, Productivity tool, Development tool).
Note: This insight is available only for software that has been normalized. To normalize software, go to Software → Normalization.
- Total Software Usage Time – KPI of all detected usage
- Last Accessed Software – Recently used apps with timestamps and device
- Unused Software Installations – Installed software never used by this member
D. Dashboard and Reports
If you’re on the Software Asset Management (SAM) or Unified ITAM plan, you may also add new widgets on the Dashboard:
- Top Used Software
- Members with Highest Software Usage
- Unused Software Installations
These help you track trends, uncover underutilized software, and prepare for license optimization or renewals.
Ready to Reclaim and Right-Size Your Software?
With AssetSonar’s Software Usage Metering, you finally have the missing link in your software usage visibility. Whether it’s spotting underused tools, identifying unmanaged installs, or monitoring software across cloud apps and on-prem devices, you’re in control.
Turn it on. Take action. Track what matters.
Need help getting started or deploying the agent? Email us at support@ezo.io — we’re happy to assist!