If you’re an IT manager, you’re likely surrounded by a lot of data.
Every device in your environment, every SaaS application, every cloud workload, and every service desk ticket generates signals about how your organization’s technology ecosystem is functioning. Endpoint agents report device health. Monitoring tools surface alerts. Asset platforms track lifecycle data. Service desks log incidents and requests around the clock.
In theory, all of this information should make IT operations easier to manage. In reality, it often creates the opposite problem.
Modern IT environments produce an overwhelming amount of operational data, but that data is neither centralized nor easy to understand. Dashboards live in different systems. Reports are scattered across tools. Critical insights remain buried inside spreadsheets or siloed platforms.
And when visibility is fragmented, the process of decision-making becomes slow.
Data alone does not improve IT operations. What matters is visibility and interpretation. IT managers need to understand patterns, detect risks early, and identify inefficiencies before they escalate into operational disruptions.
Every week, IT leaders are expected to answer questions like:
- Which infrastructure components are approaching failure?
- Where is the organization overspending on IT assets?
- Which systems or services generate the most incidents?
- How efficiently are IT resources actually being utilized?
Without strong reporting capabilities, these answers often remain hidden across disconnected systems.
This is why reporting and analytics tools have become a critical part of the modern IT operations stack.
In 2026, modern reporting platforms will help IT teams transform raw operational data into actionable intelligence through:
- centralized dashboards
- automated reporting workflows
- predictive analytics
- role-based visibility for stakeholders
These capabilities allow IT leaders to move beyond reactive troubleshooting and toward proactive operational management.
In this guide, we explore the 8 best reporting and analytics tools for IT managers in 2026, including business intelligence platforms, observability tools, and IT management systems that provide powerful built-in reporting capabilities.
What IT managers should look for in reporting & analytics tools
Before choosing a reporting platform, IT leaders must evaluate how well a tool fits into their operational ecosystem. The best tools do more than generate charts; they help teams make decisions faster.
Data integrations
Modern IT environments rely on dozens of operational systems. A reporting platform should integrate with key sources such as:
- IT asset management systems
- service desk platforms
- cloud infrastructure
- endpoint management tools
- monitoring platforms
The more data sources a platform can integrate with, the more comprehensive the insights will be.
Consider this example. An IT manager preparing for a quarterly infrastructure review wants to understand how device issues affect support workloads. By integrating data from the IT asset management system and the service desk platform, the reporting tool reveals that a specific laptop model is responsible for a high percentage of support tickets. This insight helps the IT team adjust its hardware procurement strategy.
Real-time dashboards
IT managers cannot rely solely on static reports. Operational visibility requires dashboards that update continuously.
Real-time dashboards allow teams to monitor:
- infrastructure performance
- incident volumes
- asset utilization
- IT spending trends
This enables faster responses to emerging issues.
Let’s explain this better with an example. An operations dashboard shows a sudden increase in service desk incidents related to VPN access. Because the dashboard updates in real time, the IT team immediately detects the pattern and identifies a configuration issue with a recent VPN update. The problem is resolved before it disrupts remote employees across the organization.
Automated reporting
Manual reporting consumes valuable IT resources. Modern analytics tools automate routine reporting processes, enabling leadership teams to receive consistent insights without manual data preparation.
Automation is particularly useful for:
- compliance reports
- leadership dashboards
- operational reviews
- financial reporting
Consider this example. A company preparing for a software license audit needs accurate reporting on installed software across all endpoints. Instead of manually compiling spreadsheets, the reporting platform automatically generates a monthly compliance report showing license usage, unlicensed installations, and renewal timelines. This saves hours of manual effort and reduces audit risk.
Role-based analytics
Different stakeholders require different perspectives on IT performance.
For example:
- CIOs need strategic visibility
- IT managers need operational dashboards
- Security teams require risk indicators
- Finance teams need cost analysis
Good analytics platforms allow teams to build role-specific reporting views so each stakeholder sees the insights most relevant to their role.
Let’s explain this with an example. An IT dashboard built for the CIO highlights high-level metrics such as total infrastructure cost, asset lifecycle trends, and service uptime. Meanwhile, the IT operations team uses a different dashboard that focuses on device health, ticket backlogs, and infrastructure alerts. Both views pull from the same data but present insights tailored to different audiences.
Custom reporting flexibility
Every organization tracks different operational metrics depending on its IT infrastructure, compliance requirements, and business priorities.
The best reporting tools allow IT teams to customize dashboards and build reports that reflect their specific KPIs.
This flexibility becomes particularly important in complex environments where generic dashboards are not enough.
Consider this example. A global company with multiple offices wants to track hardware utilization across locations. The IT team creates a custom report that compares device usage rates between offices and identifies locations where equipment sits idle. The insights help leadership redistribute hardware and reduce unnecessary procurement.
8 best reporting & analytics tools for IT managers in 2026
Let’s explore the 8 best reporting and analytics tools IT managers can use in 2026 to make fast and better business decisions.
1. AssetSonar
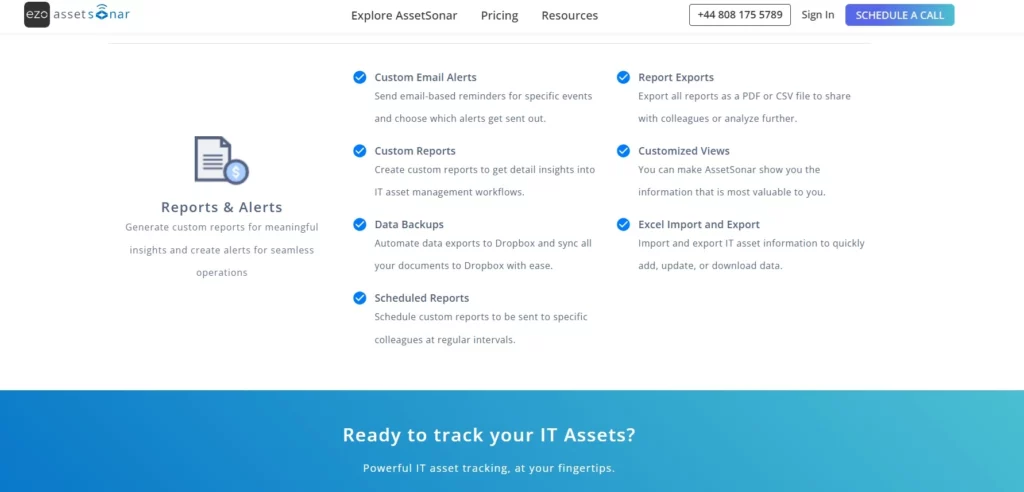
Best IT asset management platform with built-in reporting and analytics
While many tools on this list focus purely on analytics or visualization, AssetSonar approaches reporting from an IT asset management perspective.
AssetSonar is an IT Asset Management (ITAM) and Software Asset Management (SAM) platform designed to help organizations manage hardware, software, and asset lifecycles across distributed IT environments. In addition to asset discovery, lifecycle tracking, and device management, the platform includes built-in reporting and analytics capabilities that help IT teams gain deeper visibility into their asset infrastructure.
Instead of requiring external analytics tools, AssetSonar allows teams to generate operational insights directly from the asset data they manage every day.
Key capabilities
- Asset lifecycle reporting: AssetSonar allows IT teams to generate reports that track the lifecycle of hardware assets from procurement to retirement. This helps organizations understand when devices were purchased, how long they have been in use, and when they should be replaced.
- Hardware utilization insights: IT teams can analyze how devices are allocated across departments or locations, making it easier to identify underutilized hardware or rebalance equipment across teams.
- Warranty and end-of-life tracking: The platform provides reports that highlight assets approaching warranty expiration or end-of-life, enabling IT managers to plan refresh cycles before equipment failures begin to impact operations.
- Software license usage reporting: AssetSonar tracks installed software and license allocations, helping IT teams monitor usage patterns and identify potential compliance risks or unnecessary license spending.
- Custom report generation: AssetSonar also allows IT teams to create custom reports tailored to their operational needs. Teams can configure reports to analyze asset distribution, lifecycle trends, software usage, or departmental allocations, ensuring stakeholders get insights relevant to their role or operational goals.
Imagine an IT manager responsible for managing thousands of employee devices across multiple offices. Using AssetSonar’s reporting dashboards, the team can quickly identify laptops approaching the end of life or nearing warranty expiration. Instead of reacting to device failures, the IT department can proactively plan refresh cycles and budget allocations months in advance.
Why asset reporting matters
IT assets represent a significant portion of operational budgets. Without accurate reporting, organizations struggle to control costs, maintain compliance, and manage device lifecycles effectively.
AssetSonar’s reporting capabilities help IT teams:
- identify underutilized devices
- plan hardware refresh cycles
- track warranty expirations
- prepare for license or security compliance audits
- monitor software license usage
Because reporting is built directly into the asset management workflows, teams can generate operational insights without relying on complex integrations or external analytics platforms.
For organizations managing large device fleets, AssetSonar is particularly valuable for improving asset visibility, lifecycle governance, and IT financial control.
2. Microsoft Power BI
Best for enterprise IT dashboards
Microsoft Power BI remains one of the most widely adopted analytics platforms in enterprise environments. It enables organizations to consolidate operational data from multiple systems and transform it into interactive dashboards.
Power BI is particularly popular among organizations that already rely heavily on Microsoft technologies such as Azure, Microsoft 365, and SQL Server.
Key capabilities
- Interactive dashboards and reports
Power BI allows IT teams to build interactive dashboards that update dynamically as new data enters the system. Instead of static reports, users can drill down into metrics, filter datasets, and explore performance trends across different infrastructure components. - Integration with Azure and Microsoft services
The platform integrates seamlessly with Microsoft services such as Azure Monitor, Microsoft Defender, SQL Server, and Microsoft 365. This allows organizations to centralize operational data from multiple parts of their technology ecosystem within a single reporting environment. - Large ecosystem of connectors
Power BI includes hundreds of built-in connectors that allow organizations to pull data from cloud services, databases, APIs, and enterprise applications. This flexibility enables IT teams to combine operational data from service desks, infrastructure tools, financial systems, and asset management platforms. - AI-powered data insights
Power BI includes AI-assisted features that help users identify patterns, anomalies, and trends in large datasets. These capabilities allow IT teams to quickly surface insights without manually analyzing complex reports.
For IT teams, Power BI is often used to visualize infrastructure performance, track operational KPIs, and provide leadership with centralized visibility into IT operations.
Power BI is best suited for organizations that require flexible enterprise reporting across multiple operational systems.
3. Tableau

Best for advanced data visualization
Tableau is widely recognized for its powerful data visualization capabilities. It allows organizations to analyze complex datasets and present them through intuitive, highly interactive dashboards.
Many IT teams use Tableau to understand patterns in operational data such as infrastructure performance, service desk trends, and application usage.
Key capabilities
- Advanced data visualization tools
Tableau offers a wide range of visual analytics capabilities, allowing users to transform complex datasets into clear charts, graphs, and dashboards. IT teams can visualize trends such as ticket volumes, infrastructure usage, or network performance in ways that make patterns easier to identify. - Interactive data exploration
Users can interact directly with dashboards by filtering data, drilling down into metrics, and comparing datasets across time periods. This allows IT managers to investigate issues without needing to rebuild reports or run separate queries. - Support for large datasets
Tableau is designed to handle large and complex datasets often found in enterprise IT environments. This makes it suitable for organizations analyzing data from multiple infrastructure systems or operational tools. - Strong integration capabilities
The platform integrates with many databases, cloud services, and enterprise systems, enabling IT teams to consolidate operational data from different platforms into a unified reporting environment.
Tableau is ideal for organizations that require deep analytics capabilities and sophisticated visual exploration of data.
4. Datadog
Best for infrastructure and cloud analytics
Datadog is a cloud-native monitoring and analytics platform designed to provide visibility across modern infrastructure environments.
It helps IT and DevOps teams understand the performance of applications, servers, containers, and cloud services through real-time metrics and analytics dashboards.
Key capabilities
- Infrastructure monitoring dashboards
Datadog provides real-time dashboards that display performance metrics from servers, containers, databases, and cloud services. IT teams can quickly identify abnormal behavior across their infrastructure. - Application performance monitoring (APM)
The platform tracks application performance across distributed systems, allowing teams to identify latency issues, slow transactions, and bottlenecks that affect end-user experience. - Anomaly detection and alerting
Datadog uses machine learning to detect unusual patterns in system behavior. These alerts allow IT teams to investigate potential problems before they escalate into outages. - Cloud infrastructure observability
The platform integrates with major cloud providers such as AWS, Azure, and Google Cloud, providing unified visibility across hybrid and multi-cloud environments.
Datadog is particularly useful for organizations that require real-time analytics and monitoring for modern cloud infrastructure.
5. Splunk
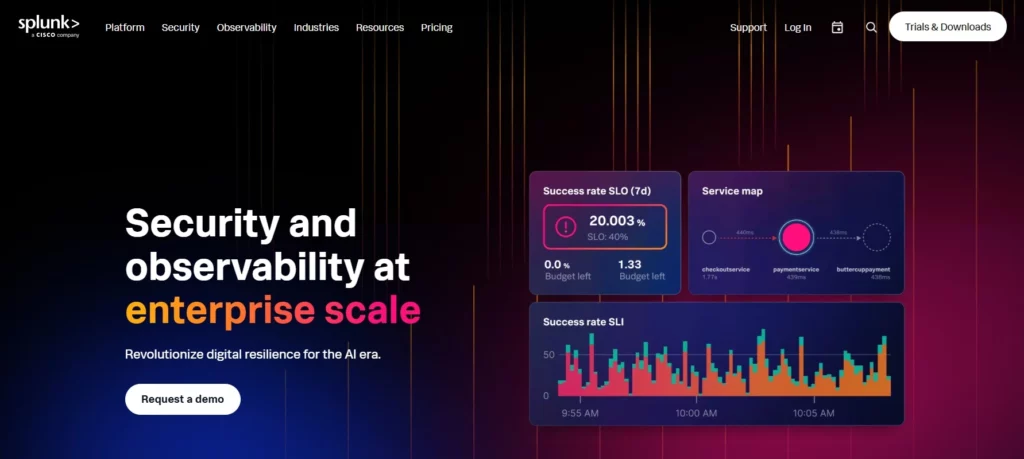
Best for log analytics and security reporting
Splunk is a powerful platform designed to analyze machine-generated data such as logs, system events, and application activity.
IT teams use Splunk to detect anomalies, investigate incidents, and gain deeper insight into system behavior.
Key capabilities
- Centralized log aggregation
Splunk collects and centralizes logs from servers, applications, security tools, and infrastructure systems. This allows IT teams to analyze events across the entire environment. - Advanced search and query capabilities
The platform allows teams to search massive datasets quickly using structured queries. This is particularly useful during incident investigations when teams need to trace events across multiple systems. - Security analytics and threat detection
Splunk provides analytics capabilities designed for identifying security risks and suspicious activity. Security teams can monitor login patterns, detect unauthorized access attempts, and analyze unusual system behavior. - Custom dashboards and reports
IT teams can create dashboards that visualize system events, security incidents, and infrastructure metrics, making it easier to communicate insights to leadership.
Splunk is best suited for organizations that need deep analytics capabilities for security monitoring and operational troubleshooting.
6. Qlik Sense
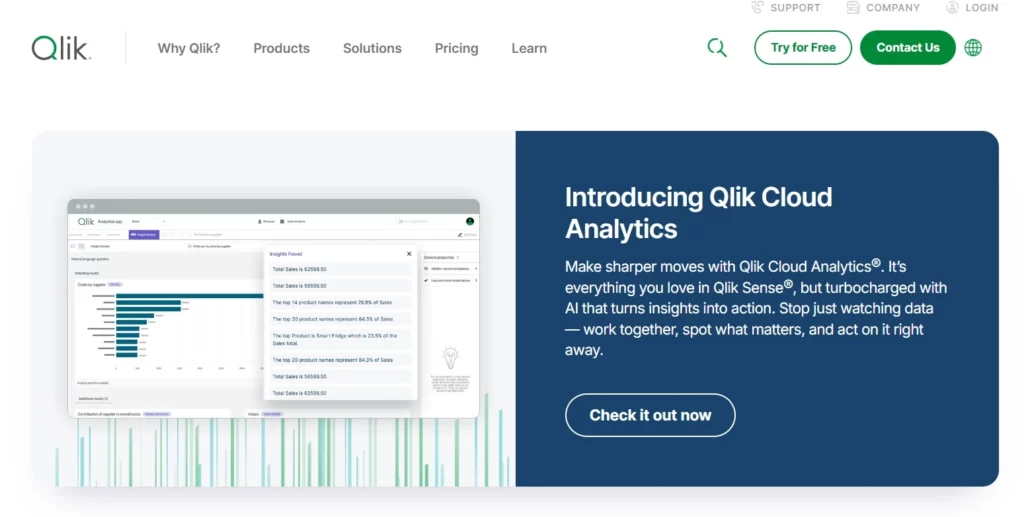
Best for self-service analytics
Qlik Sense is an analytics platform designed to enable users across the organization to explore and analyze data independently.
It focuses on self-service analytics, allowing teams to uncover insights without relying heavily on centralized data teams.
Key capabilities
- Associative data engine
Qlik Sense uses an associative data model that allows users to explore relationships between datasets dynamically. This helps teams identify correlations and patterns that may not be obvious in traditional dashboards. - AI-assisted analytics
The platform includes AI-driven insights that help users identify anomalies, trends, and correlations within their datasets. - Interactive dashboards
Users can create dashboards that allow stakeholders to filter and explore operational metrics in real time. - Enterprise data governance
Qlik Sense includes governance features that allow organizations to maintain control over data quality, security, and access permissions.
Qlik Sense works well for organizations that want to promote data-driven decision-making across multiple teams.
7. Grafana

Best for DevOps and infrastructure dashboards
Grafana is a widely used open-source platform for visualizing infrastructure and operational metrics.
It is commonly used by engineering and DevOps teams to monitor system health and performance.
Key capabilities
- Customizable dashboards
Grafana allows teams to create highly customizable dashboards that visualize metrics from monitoring tools, databases, and infrastructure platforms. - Integration with monitoring systems
The platform integrates with tools such as Prometheus, Elasticsearch, and InfluxDB, enabling teams to collect and visualize operational metrics across multiple systems. - Real-time metrics visualization
Grafana dashboards update continuously, providing real-time visibility into infrastructure performance and system health. - Alerting and notification systems
IT teams can configure alerts based on predefined thresholds. When performance metrics exceed those thresholds, the platform automatically sends alerts to relevant teams.
Grafana is particularly useful for organizations that need flexible monitoring dashboards for infrastructure and DevOps environments.
8. ServiceNow Performance Analytics
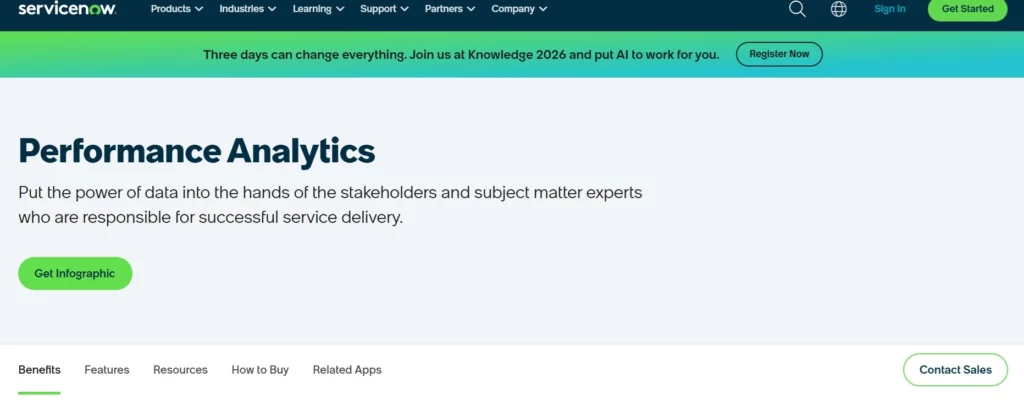
Best for IT service management reporting
ServiceNow Performance Analytics is designed to measure and improve IT service management performance.
It allows organizations to track service desk metrics, workflow efficiency, and SLA compliance.
Key capabilities
- Incident and problem management analytics
The platform provides insights into incident volumes, resolution times, and recurring service issues, helping IT teams identify operational bottlenecks. - SLA tracking and service performance metrics
IT leaders can track how effectively their teams meet service-level agreements and identify areas where service delivery needs improvement. - Operational workflow analytics
ServiceNow allows teams to analyze how requests move through service workflows and identify delays or inefficiencies. - Trend analysis and forecasting
The platform provides historical analysis that helps organizations predict future service demand and plan resource allocation more effectively.
ServiceNow Performance Analytics is best suited for organizations with mature IT service management processes and structured ITIL frameworks.
Comparison of the best reporting & analytics tools
| Tool | Category | Best Use Case |
| AssetSonar | IT Asset Management | Asset lifecycle reporting |
| Power BI | Business Intelligence | Enterprise dashboards |
| Tableau | Data Visualization | Advanced analytics |
| Datadog | Observability | Infrastructure analytics |
| Splunk | Log Analytics | Security monitoring |
| Qlik Sense | Analytics Platform | Self-service analytics |
| Grafana | Monitoring Dashboards | DevOps metrics |
| ServiceNow Performance Analytics | ITSM Analytics | Service performance reporting |
How IT managers use reporting tools in practice
Modern IT leaders rely on analytics platforms to improve both operational efficiency and strategic decision-making. Reporting tools help translate operational data into actionable insights that guide day-to-day IT management.
Improving operational visibility
Dashboards allow IT teams to monitor system health, service performance, and infrastructure stability in real time.
This visibility enables faster troubleshooting and reduces downtime because teams can detect issues before they spread across the environment.
For instance, an IT operations dashboard shows a sudden spike in CPU usage across several application servers. By identifying the issue early through the monitoring dashboard, the IT team traces the problem to a misconfigured application update and resolves it before users begin experiencing performance issues.
Controlling IT costs
Analytics tools help identify inefficiencies such as unused software licenses, idle infrastructure resources, or underutilized hardware.
These insights allow organizations to reduce waste and optimize IT spending.
A software usage report reveals that only 40% of employees assigned a premium design software license actually use it regularly. The IT team reallocates unused licenses to new users instead of purchasing additional licenses, saving the organization thousands of dollars annually.
Strengthening compliance
Many industries require organizations to maintain detailed audit trails for IT systems, devices, and software usage.
Reporting platforms help IT teams generate compliance documentation, monitor system changes, and maintain accurate asset records.
During a software license audit, the IT department generates a report listing all installed applications across company devices, along with their corresponding license allocations. Because the data is already tracked and reported automatically, the team can respond to the audit quickly without scrambling to compile information manually.
Planning technology lifecycles
Analytics insights help IT leaders predict when infrastructure components will require replacement or upgrades.
This enables proactive lifecycle planning rather than reactive upgrades that occur only after devices fail.
An asset lifecycle report shows that a large portion of employee laptops will reach their recommended replacement cycle within the next six months. The IT team uses this data to plan a phased hardware refresh, allocate budget in advance, and avoid large-scale device failures that could disrupt employee productivity.
Final thoughts
As IT environments continue to grow in complexity, data-driven decision-making is becoming essential for effective IT leadership.
Reporting and analytics tools help organizations transform operational data into actionable insights.
However, no single platform solves every reporting need.
Many organizations combine multiple solutions:
- Business intelligence platforms for leadership dashboards
- Observability tools for infrastructure monitoring
- IT management systems for operational reporting
Platforms like AssetSonar complement traditional analytics tools by providing deep reporting specifically focused on IT asset environments.
Together, these tools allow IT teams to gain the visibility they need to manage infrastructure, control costs, and maintain operational stability.

![[How-to] Generate Custom Reports in AssetSonar](https://cdn.ezo.io/wp-content/uploads/2019/09/Generating-Custom-Reports-in-AssetSonar.png)
![[How-to] Make Informed Business Decisions With Graphs For Custom Reports In AssetSonar](https://cdn.ezo.io/wp-content/uploads/2021/02/10155209/Make-Informed-Business-Decisions-With-Graphs-For-Custom-Reports-In-AssetSonar.webp)
![[How-to] Use Item Reports in AssetSonar](https://cdn.ezo.io/wp-content/uploads/2023/10/1_3P2JhKWREMGxAbzEOpEXjg.png)