EZO enhances your business decisions by helping you make sense of complex asset management data. Using the in-depth reports and analytics, you can understand reservation trends, maintenance needs and checkout volume. With the ability for administrators to organize reports into structured folders, users can effortlessly locate the insights they need. This streamlined layout empowers users to make data-driven decisions for business enhancement.
The search bar expedites the process of finding the relevant report, eliminating the hassle of manual navigation. Administrators can also improve accessibility by marking reports as favorites, moving these reports to the Bookmarked Folder. Additionally, all custom reports created by users will be automatically organized within the Custom Reports Folder. This feature is exclusively available to users on the Advanced pricing tier and above.
Benefits of Reports
The key value drivers of reports include:
Efficiency Optimization:
Structured report layouts significantly enhance operational efficiency within organizations by ensuring that information is systematically organized and easily accessible. Standardized report structures also facilitate seamless onboarding for new employees, as they can quickly familiarize themselves with the organization’s data landscape.
Informed Decision-Making:
Clear and well-organized report structures empower employees to make informed decisions based on accurate and relevant data. By providing quick access to key insights and metrics, structured reports enable stakeholders at all levels of the organization to align their decisions with strategic objectives. This informed decision-making process results in better resource allocation, improved performance, and enhanced competitiveness in the market.
Agility and Adaptability:
A structured approach to report management enables organizations to quickly adapt to changing business needs, market conditions, and regulatory requirements. Flexible reporting tools and customizable templates allow organizations to tailor reports to specific audiences and objectives, ensuring relevance and effectiveness.
How to navigate through Reports (New)
To run reports in EZO go to the main navigation bar → Reports. On the Listings page, there will be two options for viewing your reports– Grid and List view.
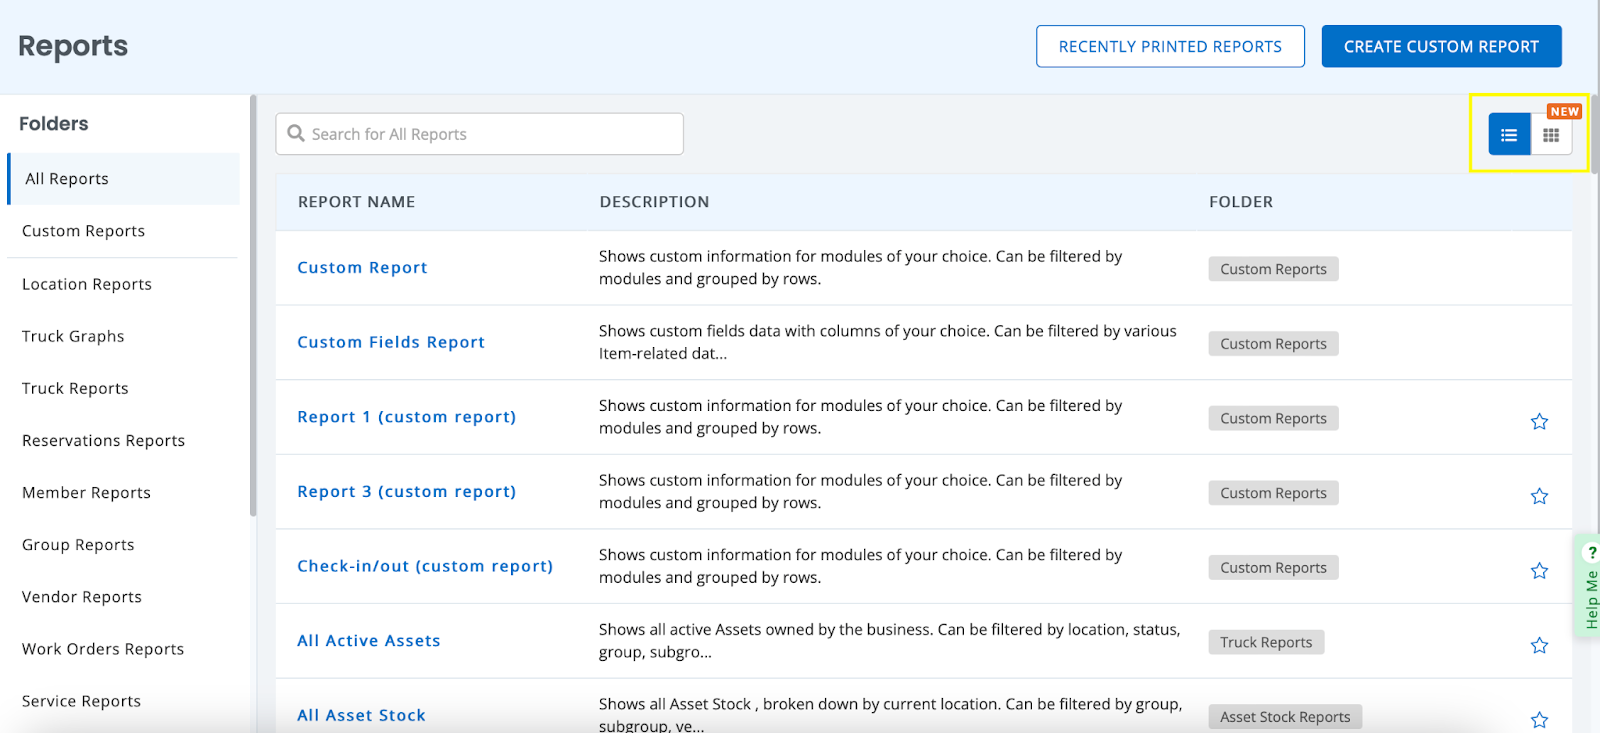
Report folders
By default all reports will be displayed starting off with the custom reports, followed by the rest of the reports in alphabetical order.
All folders will be displayed on the left side and clicking a folder will display all the relevant reports contained in that folder:
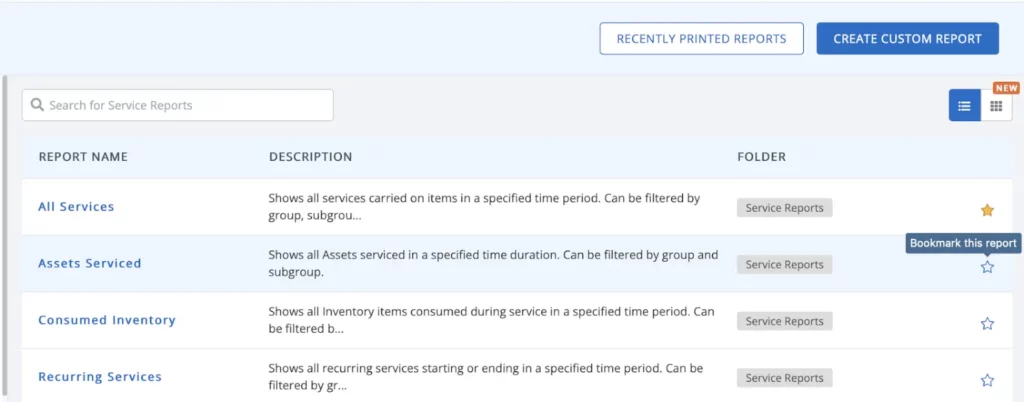
From the Listings page, you can bookmark the frequently run reports:
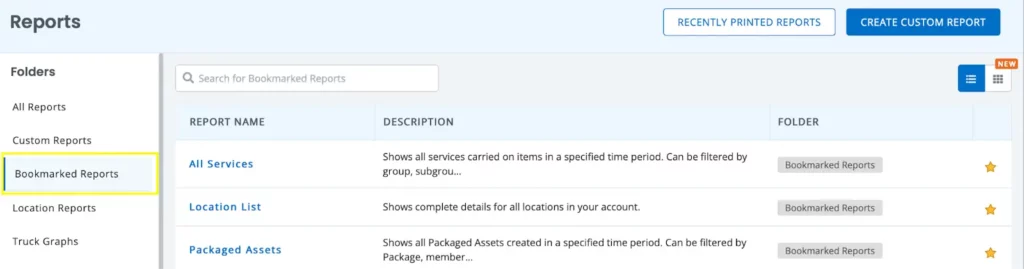
All bookmarked reports will be placed in the ‘Bookmarked’ folder as shown:
Search for reports
To make navigation easier, you can also search for your required reports. You can search within All Reports or search within specific folders as shown below:
Running item reports
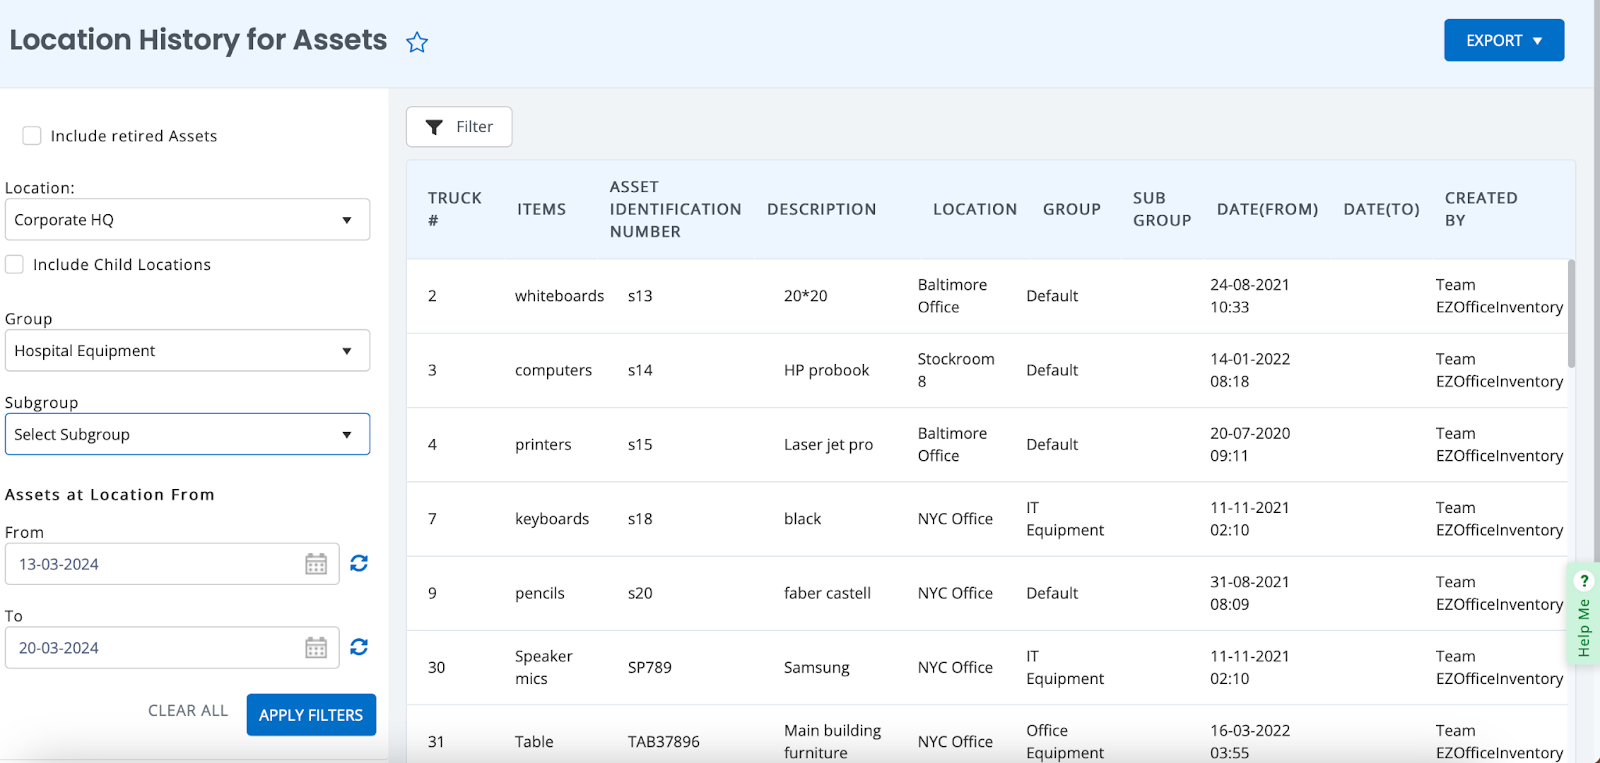
Next, let’s run a Locations report. Go to the Location’s folder or search for the Location History Report. Once the report is run, you will have the option to apply filters. Select the required filters and run the report:
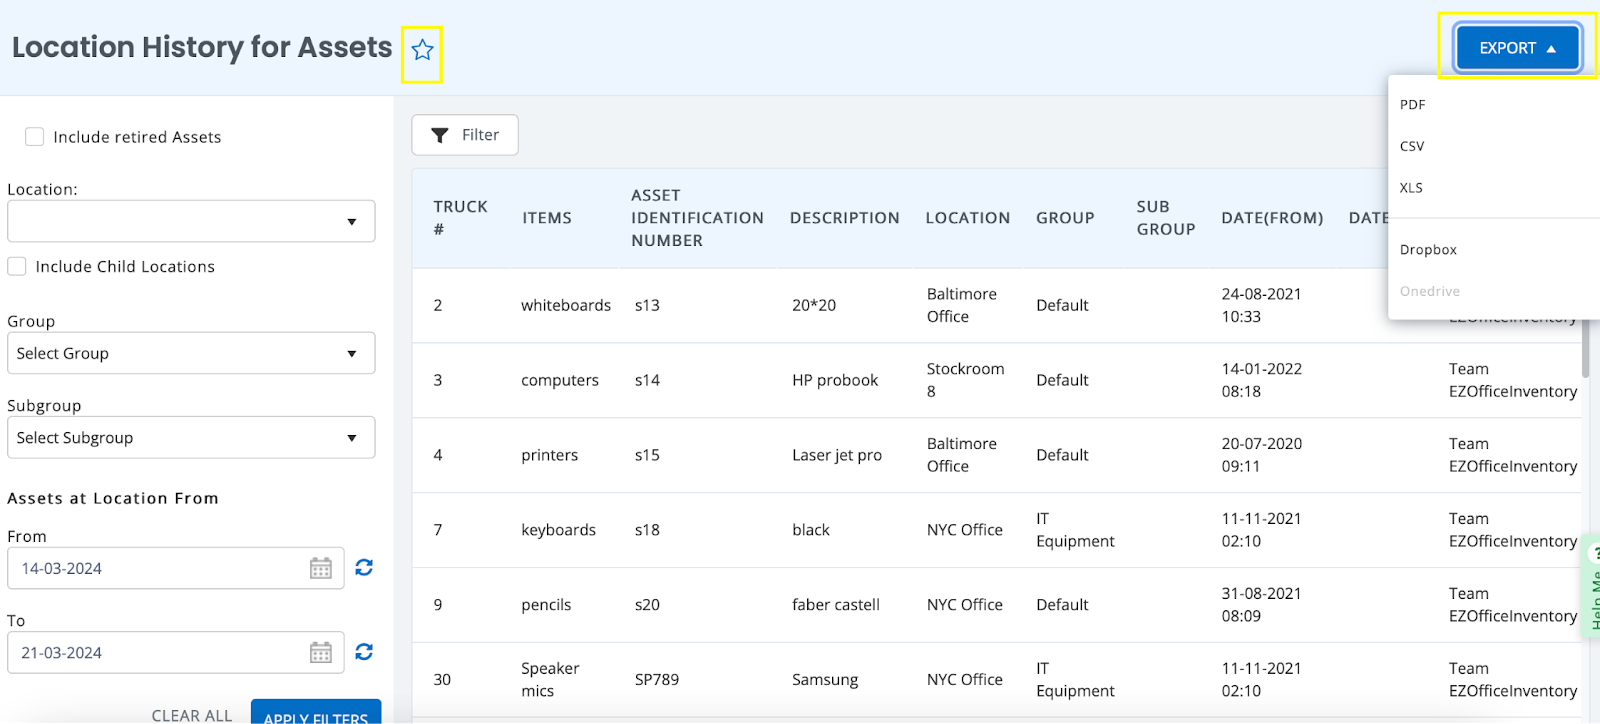
You can even bookmark your report from here or export it in 3 different formats or add it to your backup platform:
Ask Questions About Your Reports Using ZOE COPILOT
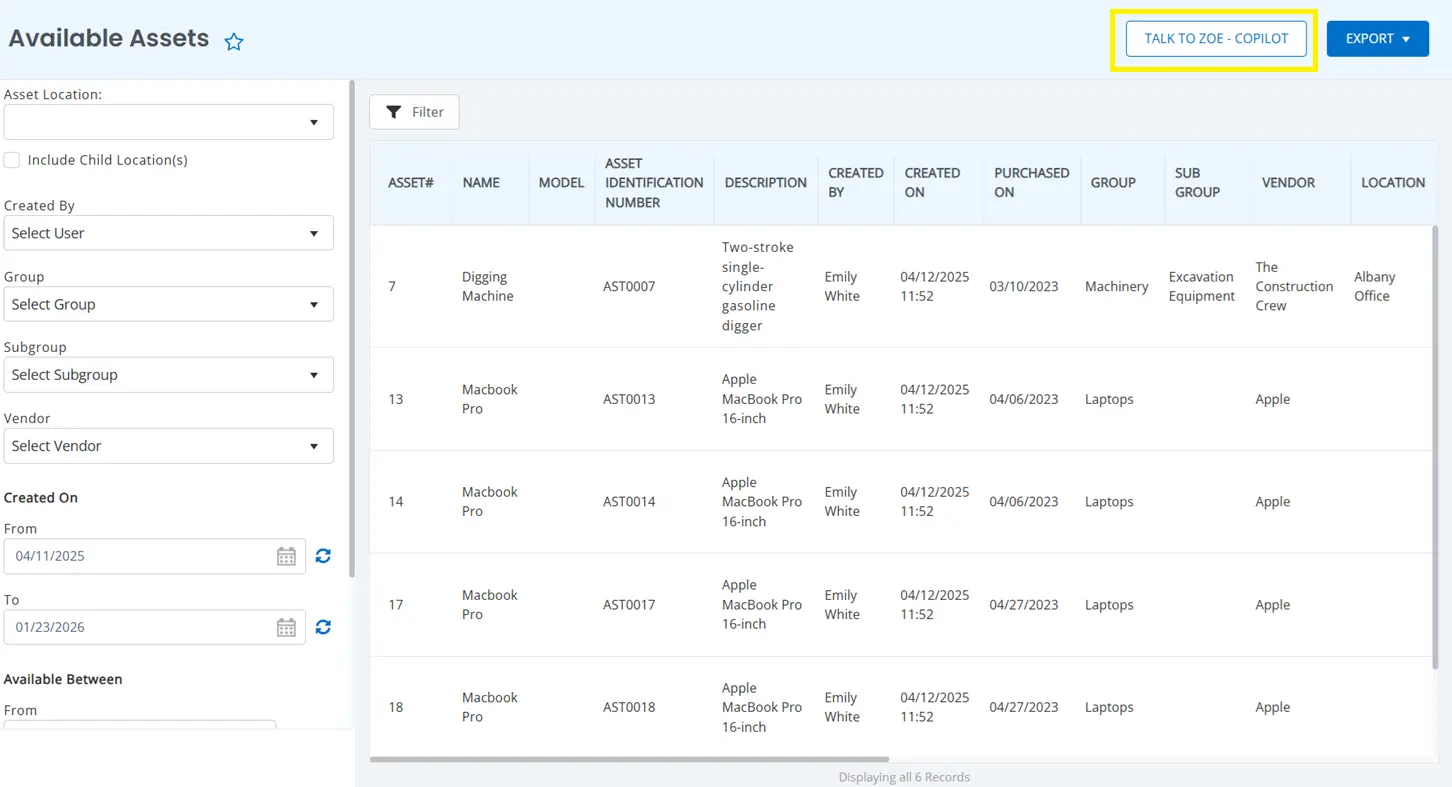
Instead of manually reviewing rows and columns in a report, you can ask ZOE questions directly about the data you’re viewing.
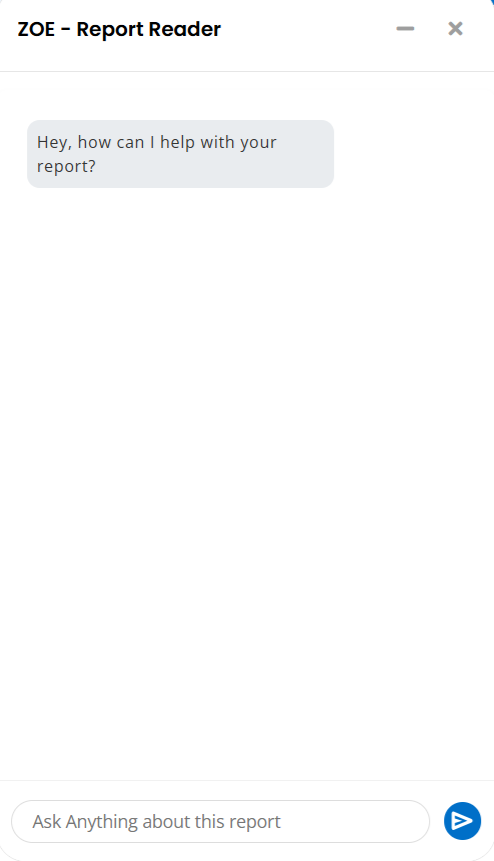
Once a report is generated, click Talk to ZOE COPILOT to start asking questions about the report.
You will be displayed the option to chat with ZOE.
When you ask it a question, it analyzes the report data and returns direct answers, helping you find insights faster without scrolling through the entire report.
You can ask questions in plain language, such as:
- How many assets were checked out between the first and fifteenth of March?
- Which assets are currently overdue?
- How many our diggers are currently in maintenance?
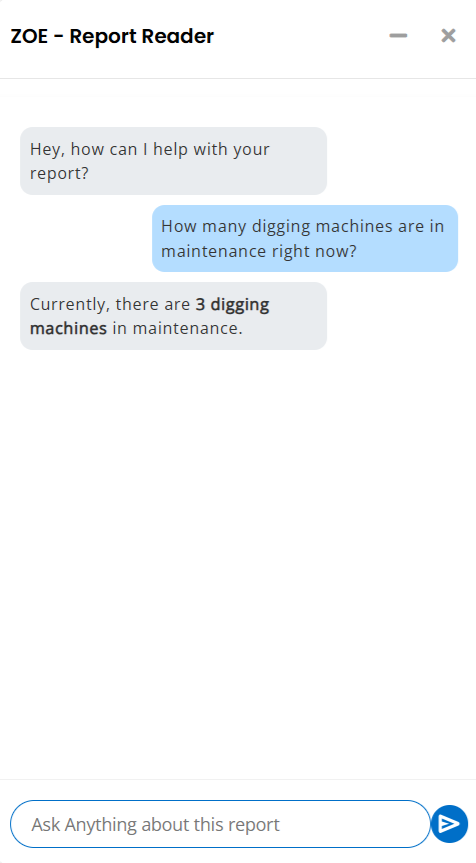
ZOE responds based on the report’s data, allowing you to explore trends, counts, and summaries without manually filtering or exporting the report.
This is especially useful when working with large reports or when you need quick answers during reviews or decision-making discussions.
Now, let’s take a walkthrough of the different types of reports you can run in EZO:
Asset Reports

Available Assets: List all available Assets. This list can be filtered by group, vendor, date of creation and stock location.
Example: ‘Detail the number of Assets available from the group ‘Digital Equipment’ and the subgroup ‘Hand-Held Devices’.
Checked Out Assets: Shows Assets that have been checked out currently, or were checked out during a specified set of dates.
Example: ‘How much of our tracked equipment was checked out between the first and fifteenth of March?’.
Check-in/Checkout Events: Details the major check-ins, check-outs and transfers relating to all or some Assets, depending on your preferences.
Example: ‘Identify the trends of transferring assets between each of our three locations’.
Overdue Assets: Lists assets that have not been returned on time. You may even pull up the borrowing history of specific users.
Example: ‘Show how many assets Ronan Strang returned late’.
Retired Assets: Gives a description of all Assets that have been retired, including the reasons for retiring them (which you can choose from a predefined list of reasons or create your own one), and the salvage value (if any).
Example: ‘How much did we get for our retired excavators last month?’.
All Active Assets: Lists all active Assets owned by the business. This includes vendor, location, status, and group filters.
Example: ‘How many of our dry vans are under maintenance currently?’.
Asset Audits: Draws up a list of all Asset audits. You will be able to find audit details based on current custodians, for example, or even the type of response the audit resulted in.
Example: ‘How many hard-disk drives has Sarah Wilcox returned damaged?’
Asset Scans: Details a list of all the Asset scans that have been done, and can be sorted on the basis of their location, the date of scanning, the scanner, or the groups or subgroups that were scanned.
Example: ‘Show me the scanning history of John Smith with reference to forklifts’.
Asset Geo-Location: Works with the scanning function and draws up a chart detailing where Assets or groups of Assets are located.
Example: ‘Where is all our surgical equipment located currently?’.
Asset Utilization: Lists the frequency of checkouts and the checkout duration of Assets, and can even be sorted according to location.
Example: ‘How much AV Equipment belonging to the subgroup ‘Video’ was checked out in the Annapolis office in the last six months?’.
Depreciation: Allows you to see the depreciated value of your Assets, as well as figures denoting depreciation per month.
Example: ‘What is the depreciated value of all surgical equipment logged in on January, 2012’.
Summary: Lists all Assets or groups of Assets that are overdue, checked out or available. You can sort these by quantity.
Example: ‘Show if ≤ 20 ventilators are available’.
Asset Aggregate Quantity: Allows you to group Assets together by location, group, vendor, or more.
Example: ‘Show the number of goods vehicles located in the Backbee Warehouse’.
Inventory Reports

All Inventory: See a list of your Inventory, broken down by current location. This list can be filtered by group, vendor and stock location.
Example: ‘Show the details of all items provided by Weirhause Ltd. in the Electronics group’.
Line Items: This provides a list of all Inventory Line Items broken down by individual action.
Example: ‘Show me all instances of stocks of stationery added, sold, or moved in Baltimore’.
Stock Summary: This shows you net quantities of Inventory within a particular timeframe.
Example: ‘Show me the net quantity of containers at the end of last month’.
Low Stock: Show which Inventory items have reached their low stock threshold or location threshold.
Example: ‘Which of the Inventory items procured from Carlisle Inc. need to be reordered?’.
Inventory Value: Enables you to gain a comprehensive overview of the current stock value of your individual Inventory items.
Example: ‘Compare the stock value of tins of lubricant added with tins of lubricant used’.
Asset Stock Reports

All Asset Stock: See a list of your Asset Stock, broken down by current location. This list can be filtered by group, vendor and stock location.
Example: ‘Show the details of all Asset Stock provided by Equip-Fix in the Power Tools group’.
Stock History: See all the actions taken on a particular Asset Stock in a specific timeframe.
Example: ‘Show me the event history for the Furniture group in the last quarter’.
Checkout Events: Lists all checkin/checkout events filtered by member, group, and vendor.
Example: ‘Show me all instances of cables being checked out by Peter Yen in the last month’.
Stock Utilization: Shows the total checkout duration of Asset Stock broken down by location.
Example: ‘Show the number of hours outdoor lights provided by Equip-Fix were used last week’.
Current Checkouts: Shows all currently checked out Asset Stock, its custodians, and the location they have been checked out to. This can be changed to show checkouts within a specific timeframe.
Example: ‘Show me all the Asset Stock checkouts Bo Riley has currently made in Baltimore’.
Asset Stock Value: Enables you to gain a comprehensive overview of the current stock value of your individual Asset Stock items.
Example: ‘Compare the stock value of Dinnerware added with Dinnerware removed’.
Bookmarking Reports
With so many reports to choose from, simplify report analysis by bookmarking your favorite reports for added convenience. Do this by clicking the star icon on the report details page, and view all your bookmarked reports in one place.

Report Permissions
When setting up roles, you can select view permissions for Reports. When the baseline role is selected as Admin the following options are available:
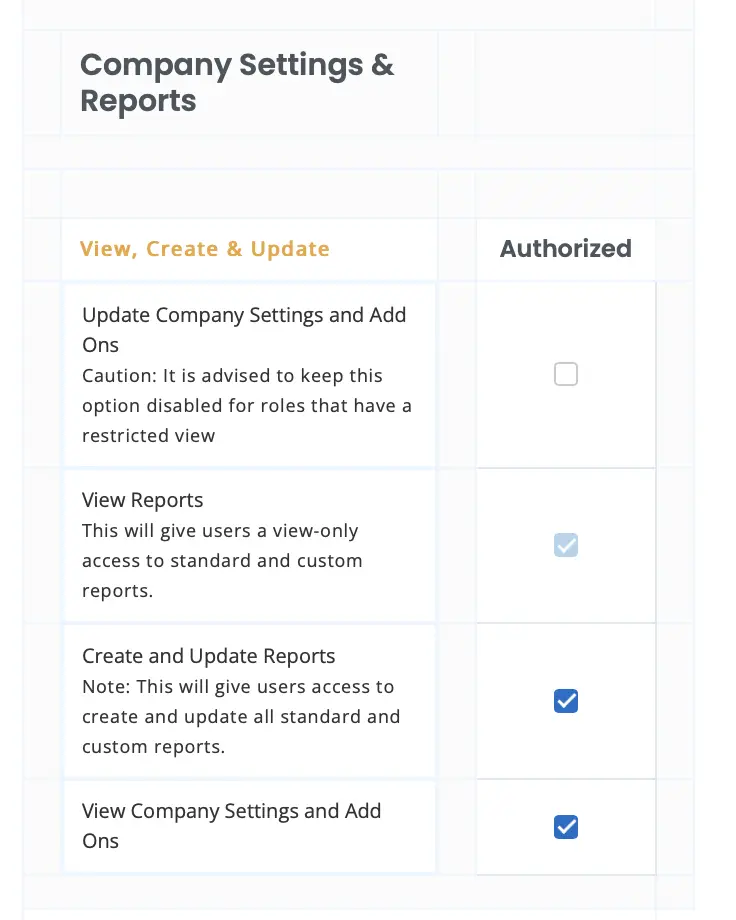
With Staff Users you can even restrict the permissions to view only for reports:

Got feedback for us?
EZO is the leading asset tracking software used by SMBs all over the globe.
For more assistance, drop us an email at support@ezo.io.