
For construction and asset management leaders, maximizing equipment ROI is a critical driver of capital efficiency and project performance. In order to achieve that, the real challenge isn’t just owning the right type of equipment. In fact, it’s deciding which machines are actually making enough to pay for themselves in the long run. The core challenge organizations face is determining which assets deliver sustainable financial return.
The solution: ROI reports. Reports backed by robust data cut the guesswork and let you decide which equipment is actually worth long term investment. A crane may appear profitable on paper but erode significant monthly capital value through idle hours. Whereas, a loader might seem like a big investment upfront but deliver sustained lifecycle value through higher reliability and asset availability.
So what’s the way to tackle such discrepancies? ROI reports. Structured, in-depth ROI reports give you data-driven insights into equipment performance, and lifecycle efficiency. While most field ops leads already track maintenance or costs but miss out on the opportunity to convert these numbers into insights. Reports uncover several trends that are not obvious through simple tracking:
- Which machines consistently run under capacity
- Which projects are over-allocating equipment
- Where maintenance spending is increasing relative to usage
- How idle time or poor scheduling erodes margins
Running ROI reports is not as hard as it looks. Here you will learn which reports can help influence ROI, how to build them from existing data, which KPIs to monitor and how to interpret them.
What ROI means for construction equipment managers?
For finance teams, ROI is a very monetary term however for enterprise teams it can be taken as the clearest indicator of your fleet’s operational health. Even though the basic formula just involves total gain divided by total cost of ownership, the net gain is more about the measurable value your equipment can deliver.
While most of the equipment managers track critical equipment metrics, they have a challenging time trying to quantify ROI at equipment level. Here are some critical factors that shape your equipment ROI:
- Utilization: The percentage of time a machine is actively working versus sitting idle. Low utilization means money tied up in underused equipment.
- Downtime: Every unscheduled repair day results in lost productivity and additional costs for rental or overtime.
- Maintenance Costs: Preventive maintenance may look like an expense, but it protects ROI by extending asset life and avoiding costly breakdowns.
- Lifespan and Depreciation: Machines nearing end-of-life cost more per productive hour; tracking this helps you plan replacements at the right time.
- Fuel and Consumables: Even small inefficiencies in fuel consumption can consume margins across a large fleet.
- Opportunity Cost: Every hour an asset sits unused is an opportunity lost. That’s capital you could have deployed elsewhere.
How do you all handle tracking job costs and overhead on projects?
byu/builderbooks2025 inConstruction
The key ROI reports critical for equipment managers
Here is a rundown of the important ROI reports you can add to your analytics dashboard to track fleet operations and cut down extra costs:
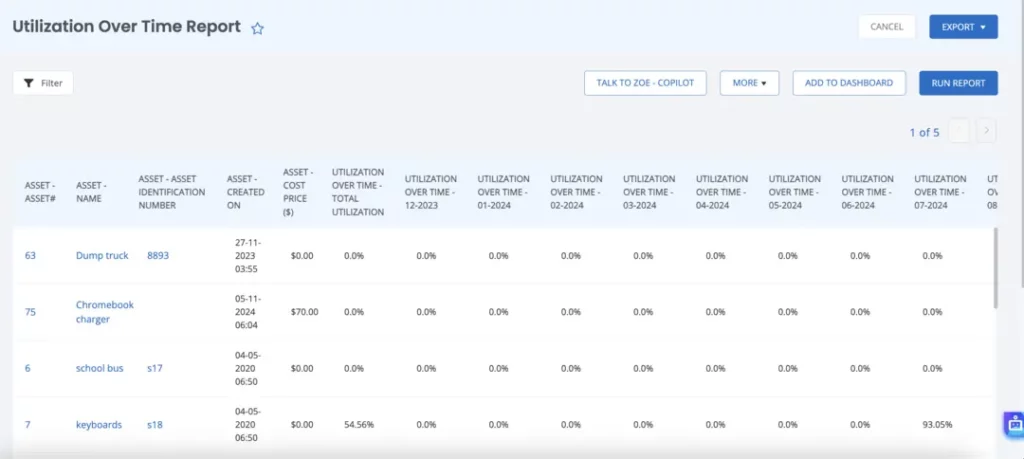
1. Equipment utilization/ availability report
This report measures the time your equipment is actively being used ( i.e it’s running or used in an operation) versus the time it’s available (ready for use but sitting idle). Basically it depicts how efficiently your fleet is running across operations.
Why does it matter for ROI?
Idle equipment is a major drain on the ROI. You end up paying hefty amounts for maintenance, fuel changes, transport and depreciation without even utilizing the machine. Alternatively, higher utilization means you’re maximizing the machine potential, and reducing unnecessary overheads.
What to track
- Total utilization percentages across all machines and by machine type (e.g., backhoes, excavators).
- Distribution of active vs. idle hours across different job sites or projects.
- Trends over time.Observe whether utilization is increasing or decreasing?
Report KPIs
- Active Hours / Available Hours: The percentage of total hours the machine is actively used.
- Utilisation by Machine Type: A breakdown by type of equipment (e.g., excavators vs. bulldozers).
- Idle Hours: The number of hours equipment sits unused.
You should be on the lookout for idle times for equipment. If a certain machine is continuously marked as idle, it could indicate you have over-invested in that asset or the equipment is not appropriate for its designated job. This can be your signal to rent or sell the equipment. Low utilization can also be a signal for poor scheduling, inefficiencies in job allocation or an overall mismatch between fleet size and project requirements.
| Equipment ID | Equipment Type | Project / Site | Active Hours | Available Hours | Utilization (%) | Idle Hours | Maintenance Downtime (hrs) | Comments / Insights |
| EXC-204 | Excavator (CAT 320D) | North Bridge Expansion | 165 | 200 | 82.5% | 25 | 10 | Excellent utilization; minimal idle time. Schedule preventive maintenance next month. |
| BLD-112 | Bulldozer (Komatsu D61PX) | East Highway Section | 88 | 180 | 48.9% | 92 | 12 | Underutilized; consider redeployment or short-term rental. |
| LDR-059 | Wheel Loader (Volvo L90H) | Central Materials Yard | 120 | 200 | 60.0% | 80 | 5 | Moderate utilization; may be impacted by scheduling inefficiencies. |
| CRN-301 | Crawler Crane (Hitachi SCX550) | City Tower Project | 190 | 220 | 86.4% | 30 | 5 | Strong utilization; nearing service threshold. Plan inspection next week. |
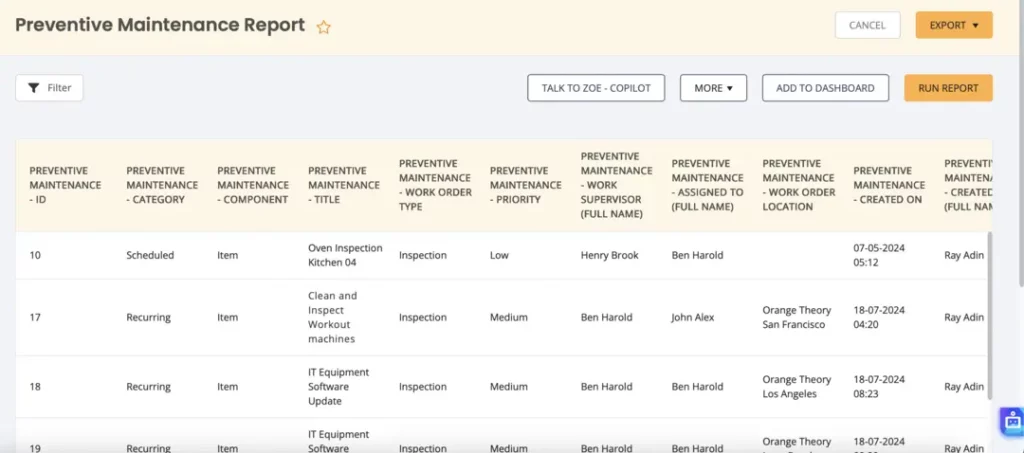
2. Maintenance cost and downtime report
This is a straightforward report that provides a detailed breakdown of the maintenance costs and unplanned downtime for each machine. It basically gives insights into costs related to spare parts, labor, and any time the machine was out of service due to repair.
Why it matters for ROI
Maintenance and downtime are two factors that significantly impact the ROI of any construction company. Unscheduled downtime leads to lost productivity, while frequent repairs can indicate aging or operational inefficiencies. Having first-hand access to this data means you are in control to take corrective action and reduce downtime costs.
What to track:
- High maintenance costs that may indicate underlying issues, such as frequent parts replacement.
- Frequent downtime across specific machines — this may signal a need for proactive maintenance or eventual replacement.
- Patterns of downtime — are certain projects or conditions causing more downtime than others?
Report KPIs
- Maintenance Cost per Hour: Total maintenance cost divided by the number of active hours.
- Downtime Hours: Total hours of unplanned downtime.
- % of Total Availability Lost: The percentage of total available hours that were lost due to downtime.
While running the maintenance report, be on the lookout for if the cost is increasing upwards without a corresponding improvement in productivity, this could mean that repairs are becoming more expensive.
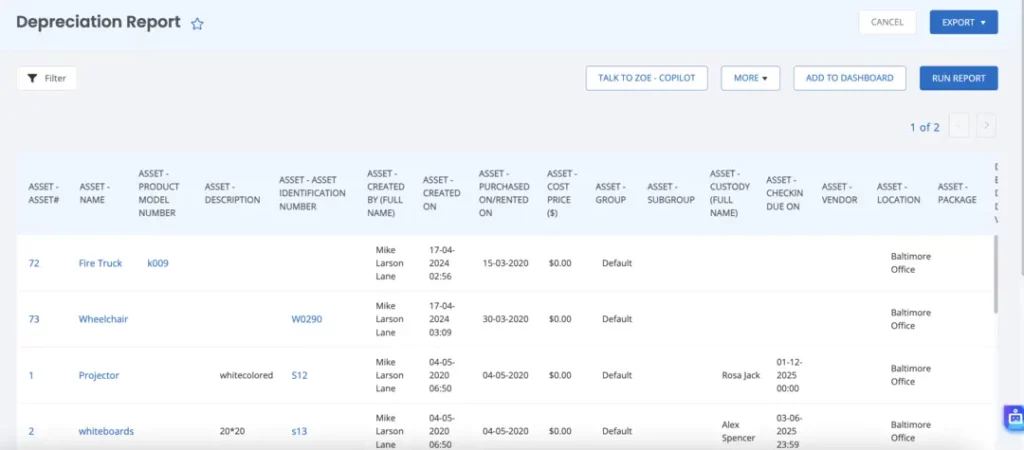
3. Lifecycle tracking report
This is an important report to track theremaining useful life of your equipment. The lifecycle report can also be set to help you calculate the salvage value in case you want to sell the equipment. Construction operations managers can use this report to plan replacements and eliminate any equipment that’s outdated and near the end of its lifespan.
Why it matters for ROI
Older equipment nearing the end of its lifecycle incurs high maintenance and repair costs. This can be an alarming factor especially if you are trying to improve your ROI. To proactively tackle such problems, stay a step ahead by running lifecycle reports. This way you can save money spent on old equipment with minimal returns.
What to track
- How much useful life is left on each piece of equipment
- Whether machines are depreciating too quickly relative to their performance
- When is the optimal time to replace equipment based on depreciation and maintenance costs?
Report KPIs
- Years of Useful Life Remaining: The time left before the machine reaches its end of life
- Salvage/Resale Value: The estimated resale value of the equipment if sold
- Cost per Year Used: The total cost of the machine divided by its age in years
Stay clear of any equipment that has rising costs with declining productivity over time. This is a sign that the machine has reached or exceeded its optimal lifespan and should be replaced. Use the report as your signal to carefully review equipment nearing the end of their lifecycle.
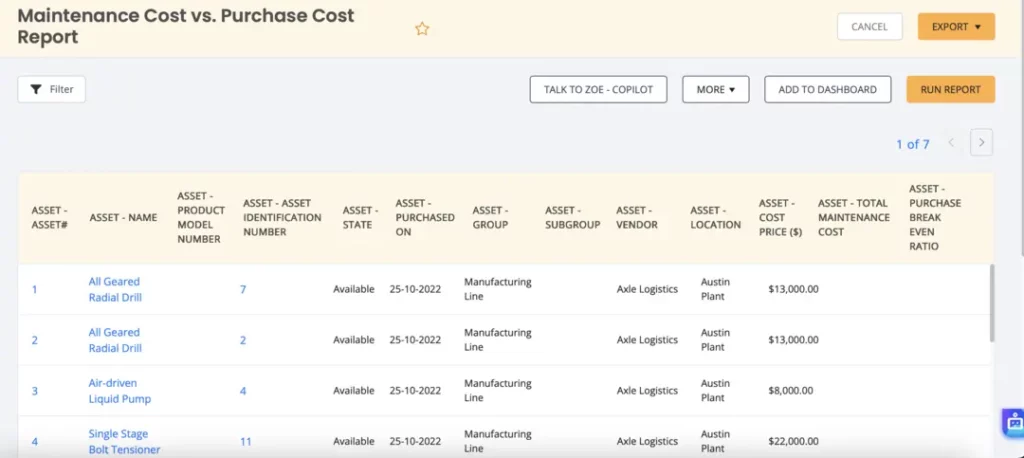
4. Total Cost of ownership report
This report can include two main sub sections for cost per hour report and the total cost of ownership report. The cost per hour report outlines the cost of owning, and operating a piece of equipment divided by the number of hours the item is in use. This includes the cost of acquisition, maintenance, repairs, fuel, insurance, and depreciation. Whereas the Total Cost of Ownership (TCO) extends this by factoring in all costs associated with the equipment over its entire lifecycle.
Why it matters for ROI
These two ownership cost reports provide a fair comparison between machines and help decide whether its efficiency to retain a piece of equipment. This report is critical in keeping the top fleet in working condition to derive maximum returns to value.
What to track
- The total cost to operate each machine and whether that’s in line with industry benchmarks
- Variations in costs between machines of the same type or model, which may indicate inefficiencies or underlying issues
- High costs per hour on under-utilized equipment
Report KPIs
- Cost per Hour: The total cost of operating a machine (including purchase, maintenance, etc.) divided by the total active hours
- Variable vs Fixed Costs: Identifies costs that fluctuate with use (fuel, repairs) versus fixed costs (depreciation, insurance)
- Industry Benchmark Comparisons: How the cost per hour compares with industry standards or similar machines
This report is your key indicator to compare if your cost per hour is exceeding the industry average benchmarks, that machine may be inefficient. Observe this trend and monitor it over time to finalize replacing equipment.
5. Fuel, consumables, and operating efficiency report
This report is designed to track how efficiently equipment uses fuel, and other consumables such as oil, filters, and hydraulic fluids. These reports help you track operating efficiency in regards to work completed.
Why it matters for ROI
Fuel and oil consumption amount to around 10-20% of the fleet operating costs. Even minute inefficiencies, like excessive idling or poor fuel management can amount to thousands of wasted dollars each month. Whereas if carefully tracked these costs can be optimized to directly boost ROI.
What to track
- Variations in fuel usage per hour between similar machines or operators
- High idle-fuel percentages indicating wasted energy
- Excessive consumables use (filters, oil) suggesting maintenance issues or operator habits
- Machines with declining fuel efficiency as indicators of mechanical wear
Report KPIs
- Fuel Usage per Hour (L/hr) — Measures consumption efficiency
- Idle Fuel % — Portion of total fuel burned during non-productive hours
- Consumables Cost per Operating Hour — Cost of oils, filters, etc., per hour of machine use
- Operating Efficiency Ratio = (Actual work output ÷ Expected work output) × 100
Some critical warning signs to look out for include machines consuming more than 15% of the average industry benchmark. Idle fuel % consistently above 25% , and rising consumable costs per hour may result from leaks or improper maintenance. For example, a grader burning 25 L/hr against a benchmark of 18 L/hr is using 39% more fuel than expected. Fixing this through operator training or engine tuning could save hundreds per week.
6. Equipment assignment and usage by site
This report is used to gauge which equipment is deployed at which site, how long they have been there, and their usage trends. Mainly this report is designed to show how your fleet is utilized across various projects and pinpoint any areas where there is a shortage or over supply.
According to a construction ops leader on Reddit, “Rather than looking at the costs individually, look at the health of the project in understandable chunks. Look at costs to date, and check whether the remaining budget is enough to complete the remaining work. If you are halfway done with Task 1, but have spent 75% of the budget, you’ve got a problem. At that point, you drill down to figure out what is causing a cost overrun”.
Construction Pros, What kind of things should I look for in a cost report?
byu/Fatzillllla inConstruction
Why it matters for ROI
Even the best of equipment loses its value when it’s placed at the wrong site. Having an accurate idea of where each equipment is stationed gives construction ops leader a realistic picture of how many machines are sitting idle vs how many are being actively used for ongoing projects.
What to track
- Projects with low average equipment utilization
- Machines sitting idle >2 weeks while other sites rent extras
- Mismatched asset types (e.g., too many excavators on a finishing site)
- Repeated relocation requests = inefficient planning
Report KPIs
- % Utilization per Project = (Active hours ÷ Available hours per site)
- Machine Assignment Efficiency = % of machines actively engaged in productive tasks
- Idle Machines by Site Count — Number of underused assets per location
- Inter-site Transfer Rate — Frequency of equipment relocation (balancing indicator)
These reports can help you uncover machines sitting idle on certain project sites whereas others other projects incur rental costs. If you notice frequent last-minute transfers that’s a sign for poor planning.
How to build construction ROI reports: Tools, process, and data requirements
Let’s review the steps involved in building your ideal reports:
1. Data Sources
The first step without doubt to build a reliable report is to gather data from accurate sources. Here are some key sources to gather your data from:
- Telematics/metering system: These systems are highly accurate in tracking real-time fuel consumption, idle hours, and operating hours along with condition of key components.
- Maintenance logs: These are usually tracked within a maintenance management system and keep a record of repairs, schedules, and replacement parts along with costs incurred at each stage.
- Depreciation schedules: Any good maintenance management system tracks depreciation schedules that tracks the decrease in fleet value over time.
- Project assignments: If you want to get granular analytics then retrieve project assignment data to track where each equipment is placed for a project.
2. Choosing the right tools
After you have extracted the data, the next step is to choose how you want to run your reports. There are two primary approaches:
- Manual spreadsheets: Legacy spreadsheet-based reporting creates data fragmentation and limits scalability in complex fleet environments. This option is generally considered appropriate for low maturity environments with limited scalablity.
- Asset Management System: This is the automated approach which collects data, integrates telematics, and streamlines report generation. Enables you to handle large volumes of data and gain actionable insights in real-time. Recommended for larger fleets, companies scaling their operations, and those seeking to centralize data for efficiency.
3. Process and best practices
A reliable process for running reports is your best bet to attain the data you actually need. Here are some practices to keep in mind:
Standardized data entry: Reports are only useful if all data is being tracked in a uniform manner. For example, train all operators to log meter hours in the same way and log breakdowns with consistent details across projects.
Automate data capture: While manual data entry may seem cheap at first, it takes up a lot of your time and effort. The best way is to deploy a maintenance management system that tracks depreciation, work logs, and associated costs at a single place.
Schedule and review reports: Manually running reports can be inefficient. Invest in a system to automatically schedule reports so that all stakeholders are updated on valuable insights on time. Use monthly reviews to catch any trends, and quarterly deep dives for long-term decisions like fleet renewal or budget planning.
Assign Responsibility:
Assign clear ownership of different data types and reports:
- Equipment Manager: Responsible for utilization, maintenance logs, and fuel efficiency.
- Finance Liaison: Ensures accurate cost allocations, depreciation, and investment decisions.
- Project Site Lead: Tracks equipment allocation and operational needs.
Unlocking ROI reports for smarter fleet management
The only way to derive maximum ROI from your fleet is to optimize its cost to productivity ratio. This can only be achieved when you are actively tracking costs and outcomes related to all your equipment aka ROI reports. By consistently tracking fuel costs, consumption, maintenance expenses construction managers gain the clarity needed to make informed decisions regarding fleet replacements, maintenance and budget allocation.
You don’t have to get started with all these reports on day 1. Pick one report from the ones listed above and run it for 30 days. Just note down the insights and review them by the end of the month to make any decisions.
EZO CMMS is a maintenance management system that automatically compiles critical equipment data into actionable reports. With the new AI capabilities you don’t even need to set up a report, you can simply ask the chatbot to prepare one by following your instructions. That’s the best of automation that you can get. Operationalize enterprise-grade ROI visibility across your fleet with EZO.