
Key Takeaways:
- A spare parts audit should verify quantity, location, identity, condition, and actual availability, not just physical counts.
Audit scope should prioritize critical, high-value, high-velocity, long-lead-time, and recurring-variance parts rather than treating every SKU equally.
Criticality should reflect failure consequences, safety impact, lead time, sourcing difficulty, substitutability, and maintenance dependency, not purchase price alone.
Inventory can be physically accurate yet operationally unavailable when parts are reserved, quarantined, damaged, awaiting inspection, or inaccessible.
Investigate quantity discrepancies for root causes before adjusting inventory records, or the same errors can return.
Connecting spare parts to work orders and assets creates traceability from part consumption to maintenance history and helps identify inventory-related repair delays.
Sustained inventory accuracy requires risk-based cycle counting and maintenance-focused KPIs such as parts-related repair delays, stockout downtime, and emergency purchases.
A technician comes to the storeroom window with a work order. The system shows a seal kit is in stock, but the bin is empty. To keep the repair moving, someone places an emergency order outside the normal reorder process, then adjusts the record later.
That single discrepancy can create more than a stockout. It can lead to duplicate purchases, emergency freight, maintenance delays, excess inventory, and a storeroom team that no longer trusts its own data.
A spare parts audit breaks that cycle by comparing physical inventory with the system of record, identifying why discrepancies exist, and fixing the workflows that let them return.
For maintenance organizations, the goal isn’t simply to make the inventory system match the shelves. It is to make sure the right parts are identified, available, accessible, and connected to the maintenance work that needs them.
This guide explains how to conduct a spare parts audit, determine what to count, classify inventory by risk, reconcile discrepancies, fix control gaps, and build a cycle-counting process that keeps accuracy from degrading again.
Spare parts audit checklist: At a glance
Before getting into the detailed process, use this checklist to structure the audit:
- Define the locations, part classes, and inventory types included in the audit.
- Identify critical, high-value, high-velocity, and high-risk spare parts.
- Decide whether you need a full physical count, targeted count, or risk-based sample.
- Establish a transaction cutoff and rules for receipts, issues, returns, and transfers during the count.
- Confirm the system-of-record baseline before you begin counting.
- Verify quantity, location, identity, condition, and availability status.
- Use blind counts where practical to reduce confirmation bias.
- Record every variance in a standardized variance log.
- Investigate high-impact and recurring variances instead of simply adjusting quantities.
- Separate physical availability from system on-hand quantity.
- Review min/max levels and reorder points after correcting inventory records.
- Assign owners, deadlines, and verification steps for control fixes.
- Connect parts consumption to maintenance work orders where possible.
- Establish risk-based cycle-count frequencies.
- Track inventory accuracy alongside maintenance and operational outcomes.
The detailed process below expands each step.
What a spare parts audit is and what it is not
A spare parts audit is an operational validation of spare parts inventory across several dimensions:
- Quantity: how many units physically exist.
- Location: where those units are physically stored.
- Identity: whether the physical part matches the item record and whether duplicate records exist.
- Condition: whether the part is serviceable, damaged, expired, or otherwise unsuitable for use.
- Status and availability: whether the part is available, reserved, quarantined, allocated, at a repair vendor, or otherwise unavailable for the maintenance work that needs it.
It can also surface questions about valuation, obsolescence, ownership, and traceability. If you expect to post inventory adjustments, write off obsolete stock, or change valuation treatment, involve finance early so approvals, cutoffs, and documentation requirements are clear.
What a spare parts audit is not
Not only a wall-to-wall count. The physical count provides evidence. The objective is to understand and correct the processes that created the discrepancy.
Not automatically a formal financial audit. An operational spare parts audit can improve inventory accuracy and maintenance execution. Financial reporting requirements may introduce additional controls around valuation, ownership, cutoff procedures, evidence, and approvals.
The distinction matters because a count that simply changes the system quantity to match the shelf can make the records look accurate without fixing the process that caused the error.
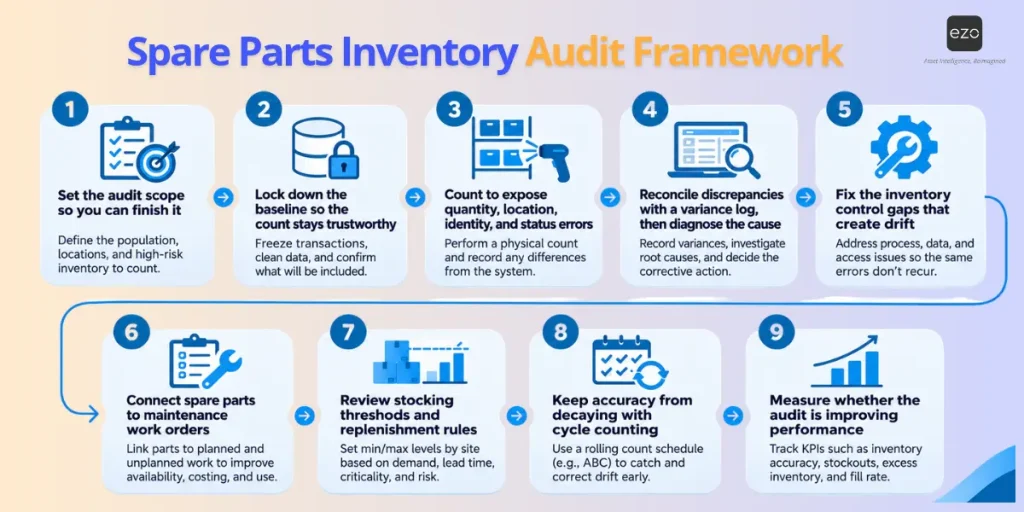
Step 1: Set the audit scope so you can finish it
Many storerooms cannot audit every stock-keeping unit (SKU) at once without disrupting maintenance. The first decision, therefore, is not “How do we count everything?” It is:
Which inventory creates the greatest risk if its quantity, location, identity, condition, or availability is wrong?
Start by defining the full audit population, then use risk to determine which inventory requires a full count and which can be sampled.
Define the audit population before counting
Define the audit population by ownership, inventory status, and physical location, not simply by what sits inside the storeroom.
Include every location where spare parts can be held, issued, staged, transferred, or awaiting disposition. Depending on the operation, this may include:
- Central and satellite storerooms
- Technician vehicles and mobile stock
- Tool cribs and point-of-use cabinets
- Staged maintenance kits, carts, and job boxes
- Production or work areas holding maintenance spares
- Project or site storage
- Repair-vendor locations where company-owned parts are held
- Receiving areas for inventory that has arrived but has not yet been put away
- Inventory in transit between locations
Before the count begins, document which locations are controlled, which are uncontrolled or informal, and which inventory populations are included or excluded.
Separate inventory by ownership and status
Do not automatically combine all physically present parts into one inventory total.
Identify at least:
- Company-owned inventory: Parts the organization owns and includes in its inventory records.
- Consignment inventory: Parts the organization physically holds but that a supplier or other third party owns. Reconcile these separately against the applicable ownership records or agreement.
- Company-owned parts at repair vendors: Reconcile these against dispatch records, vendor confirmations, repair status, and expected return dates.
- Third-party-owned stock: Identify separately and reconcile against the applicable consignment or ownership agreement.
- In-transit inventory: Parts shipped or transferred but not yet physically received at the destination.
Ownership, location, and status can overlap. A company-owned part may also be in transit or at a repair vendor; count it once and record each attribute separately.
Keep in-transit inventory as a separate category until you physically receive it. Establish a transaction cutoff for receipts, transfers, issues, and returns, then reconcile shipments and transfers against the relevant records to prevent double-counting or omission.
The objective is to establish one clearly defined audit population so that every relevant part is either counted, separately reconciled, or explicitly excluded with a documented reason.
If you operate across multiple sites, define an audit treatment for every in-scope location, whether it is fully counted, sampled, separately reconciled, or explicitly excluded.
Identify the inventory that carries the most risk
Once you define the population, identify the parts where an inaccurate record could have the greatest operational, financial, or supply-chain consequence.
Prioritize:
- Critical spares: Parts whose unavailability can stop production, create significant safety consequences, or block a critical repair.
- High-value items: Parts with significant unit cost or inventory value that warrant tighter financial and inventory controls.
- High-velocity items: Frequently issued parts and consumables that can quickly accumulate transaction errors.
- Long-lead-time items: Parts that take significant or uncertain time to procure or replace.
- Supply-constrained items: Parts with limited suppliers, difficult sourcing conditions, or few practical substitutes.
- Recurring-variance items: Parts that repeatedly show discrepancies in quantity, location, identity, or status.
- Known problem areas: Mixed bins, unlabeled shelves, unofficial overflow storage, and locations with repeated inventory errors.
- Multi-site inventory: Parts held at a site from which they cannot reach the maintenance job in time for the maintenance team that needs them.
- New or relocated inventory: Parts whose records or locations may not yet be stable.
Do not treat these factors as interchangeable. Criticality describes the consequence of a part being unavailable. Value describes financial significance. Demand or movement describes how frequently inventory changes. Lead time and sourcing difficulty describe supply risk. Historical variance indicates where existing controls may be unreliable.
Determine whether to use a full count or a sample
No universal percentage of inventory applies to every storeroom. The appropriate scope depends on the audit’s purpose, inventory risk, operational disruption, inventory complexity, and the reliability of existing records.
Use this three-tier approach:
| Inventory profile | Recommended approach |
| Critical or otherwise defined as high-risk | Full count |
| High-value, long-lead-time, supply-constrained, or recurring-variance inventory | Targeted full count or expanded sample |
| Stable, lower-risk inventory with a reliable accuracy history | Risk-stratified sample |
Full count: Count 100% of critical spares and other inventory where an inaccurate record could create significant safety, production, maintenance, or operational risk.
Targeted full count or expanded sample: Provide additional coverage for high-value parts, long-lead-time items, supply-constrained parts, recurring-variance items, and inventory tied to current maintenance bottlenecks. Depending on risk, this may mean counting the entire category or increasing its representation in the sample.
Risk-stratified sample: For stable, lower-risk inventory, select items across sites, storage locations, ABC classes, movement rates, inventory values, criticality levels, and historical variance. Avoid selecting only convenient bins because they are easier to count.
Set the sampling rules before you count
If the audit uses sampling, define the rules before the first count. Document:
- Which inventory populations are eligible for sampling
- Which items require a full count regardless of sampling
- How sampled items will be selected
- Which dimensions will be used for stratification, such as site, value, movement, criticality, and variance history
- The discrepancy tolerance that will trigger additional testing
- Who can approve a scope expansion
For formal audits that require quantified confidence and error tolerance, use an appropriate statistical sampling method rather than an arbitrary percentage.
For operational audits where formal statistical precision isn’t required, a risk-stratified sample can provide practical coverage without a wall-to-wall count.
Define when the sample must expand
Don’t treat a sample as sufficient just because you have counted the planned number of items.
Before starting, define the discrepancy level that will trigger additional testing. For example, an organization might set an operational rule that if the observed discrepancy rate exceeds its predefined tolerance, it expands the affected inventory group to a larger sample or a full count.
The threshold should reflect the organization’s risk tolerance, inventory value, criticality, and audit purpose. It is an internal control rule, not a universal industry standard.
Use this decision path:
Critical inventory → Full count
High value, long lead time, supply constraint, or recurring variance → Targeted full count or expanded sample
Stable, low-risk inventory → Risk-stratified sample
Observed discrepancy rate exceeds the predefined tolerance → Expand the affected sample or move to a full count
The objective is not to find a universal inventory percentage to count. It is to apply enough verification to provide reasonable confidence that the inventory records supporting maintenance decisions are reliable.
Classify criticality before counting
Not every spare part carries the same operational risk. Classify parts based on the consequences of unavailability when needed, not purchase price or usage alone.
A practical criticality assessment can consider:
| Factor | Low | Medium | High |
| Consequence of unavailability | Minimal disruption | Local maintenance delay | Major production, operational, or service disruption |
| Safety impact | Little or no safety impact | Additional controls required | Significant safety consequences possible |
| Production or operational impact | Easily worked around | Reduced capacity or localized delay | Critical operation may stop |
| Lead time | Readily available | Moderate lead time | Long or uncertain lead time |
| Substitutability | Easy substitute available | Limited alternatives | No practical substitute |
| Sourcing difficulty | Multiple reliable sources | Limited suppliers | Specialized or difficult to source |
| Equipment dependency | Few assets depend on it | Several assets depend on it | Critical equipment depends on it |
This framework is illustrative, not a universal industry standard. Organizations should define their own scoring thresholds based on equipment criticality, operating risk, supply conditions, and maintenance requirements.
Turn the assessment into a practical score
For a simple internal framework, assign each factor a score from 1 to 3:
- 1 = Low
- 2 = Medium
- 3 = High
Assess operational criticality separately from supply risk. Rate safety and operational consequences first, then assess lead time, substitutability, and sourcing difficulty. Use both assessments to set inventory control priorities. The organization can then define its own bands for low-, medium-, and high-criticality parts.
For example, consider a specialized hydraulic component used on a critical excavator:
| Factor | Score |
| Consequence of unavailability | 3 |
| Safety impact | 3 |
| Production/operational impact | 3 |
| Lead time | 3 |
| Substitutability | 3 |
| Sourcing difficulty | 2 |
| Equipment dependency | 3 |
| Total | 20/21 |
A score this high indicates that the component deserves high-priority inventory controls, such as tighter count frequency, verified storage location, clear availability status, and closer monitoring of replenishment risk.
The organization sets the exact score bands. The important point is to make the classification repeatable and document why a part receives its assigned criticality.
Keep demand frequency separate
Failure or demand frequency helps with inventory planning, but it should not automatically determine criticality.
A frequently consumed part may need higher stock levels because demand is high. A rarely used part may still be highly critical if its absence can stop a critical asset and replacement takes months.
Use demand or failure frequency as a planning modifier alongside criticality:
- High criticality + low demand: Consider controlled strategic stock and tighter availability checks.
- High criticality + high demand: Combine tight controls with appropriate replenishment planning.
- Low criticality + high demand: Prioritize stock availability based on consumption without automatically treating the part as operationally critical.
- Low criticality + low demand: Simpler controls may be appropriate where the consequences of failure are limited.
This distinction prevents inventory value, consumption, and operational criticality from being treated as the same thing.
Use ABC and risk-based classification
ABC analysis and criticality classification answer different questions, so treat them as separate dimensions.
ABC analysis typically ranks inventory using a quantitative measure such as annual consumption value, calculated by multiplying annual usage by unit cost. The organization then sets its own thresholds for A, B, and C categories based on its inventory distribution.
For example:
- A items: Represent the highest share of annual consumption value and typically warrant tighter inventory controls.
- B items: Fall into the middle range of annual consumption value and generally receive standard controls.
- C items: Represent the lower share of annual consumption value and may be managed with simpler controls where operational risk is also low.
Do not treat these categories as a measure of operational importance. A low-cost C item can still be critical if its absence can stop equipment or create a safety concern, or if replenishment has a long and uncertain lead time.
Layer ABC classification with separate factors such as:
- Criticality
- Lead time
- Sourcing difficulty
- Availability of substitutes
- Equipment dependency
- Historical inventory variance
The result is more useful than value alone. ABC analysis shows where inventory value is concentrated, while criticality and risk show where an inventory error could cause the most operational damage.
For example, a $20 seal used frequently across a fleet may be an A item because its annual consumption value is high. A $2,000 specialized component used only once every few years may be a C item by consumption value but still require tight control because replacing it takes six months and its absence can keep critical equipment offline.
The key distinction is that ABC prioritizes controls by inventory value, while criticality prioritizes them by operational consequence.
Step 2: Lock down the baseline so the count stays trustworthy
A physical count is a snapshot. If inventory keeps moving while you count, the snapshot becomes difficult to reconcile.
Before starting, define the operating rules for the audit window.
Establish a transaction cutoff
Decide how you will handle:
- Receipts
- Withdrawals
- Returns
- Transfers
- Scrap
- Emergency issues
- Parts being moved between bins
- Inventory arriving during the count
Document when the cutoff begins and ends. Save a timestamped baseline of recorded quantities by SKU, location, and unit of measure. Record each count’s time and reconcile intervening receipts, issues, returns, and transfers to the same cutoff.
Keep emergency maintenance moving
An audit should not prevent a critical repair.
If parts must be issued during the count, use a controlled process such as an emergency issue slip or transaction log. Record the issue when it happens and reconcile it within a defined deadline.
The goal is not to freeze operations. It is to prevent emergency work from becoming an undocumented exception.
Assign clear roles
At minimum, define:
- Counters
- Reviewer/reconciler
- Inventory or master-data owner
Where practical, avoid having someone count the bins they normally manage. Separation of duties can reduce confirmation bias and make discrepancies easier to challenge.
Confirm the location hierarchy
Use a consistent structure such as:
Site → storeroom → aisle → shelf → bin
If unofficial locations exist, document them instead of pretending they don’t.
Parts on an unrecorded overflow shelf are still inventory.
Step 3: Count to expose quantity, location, identity, and status errors
Storeroom drift is rarely only a math problem.
The right part may be in the wrong bin. The wrong part may be in the right bin. Two item records may represent the same physical part. A physically present part may also be damaged, expired, reserved, or awaiting inspection.
Use both counting directions where practical
Trace selected records to physical stock to test existence, and trace selected physical stock back to records to test completeness.
Location-first/bin-to-item
Start with a physical location and record what is actually there.
This works well when:
- Location records are unreliable
- Unofficial storage is common
- Parts are frequently misplaced
- You suspect duplicate or unidentified inventory
Item-first/item-to-bin
Start with the system item list and verify each item’s physical location.
This works better when:
- Location data is mature
- Bin structures are controlled
- You are validating compliance with an established inventory structure
Build controls into the count
Use blind counts where possible. Counters should record what they see without first viewing the system quantity. Compare the physical result to the system during reconciliation.
Standardize the unit of measure. Make sure “each,” “box,” “pack,” “case,” and other units are defined consistently.
Flag unknowns instead of forcing a match. If you can’t confidently identify a part, record an identity exception.
Define recount triggers. Require recounts for missing critical spares, large discrepancies, unidentified parts, or other predefined exceptions.
Don’t count “on hand” as automatically “available”
This distinction is critical.
Imagine the system reports:
- 10 units on hand
- 4 reserved for upcoming work
- 2 quarantined
- 1 awaiting inspection
- 3 available
The storeroom has 10 physical units, but only 3 are currently available for new maintenance demand.
An audit should therefore distinguish physical quantity, condition, allocation status, and available-to-issue quantity.
Inventory accuracy vs. Available-to-issue share
A spare parts record can be numerically accurate and still fail maintenance.
Suppose the system says a storeroom has five replacement motors. You physically verify five motors, so the recorded quantity is accurate.
But if:
- Two are reserved for existing work orders
- One is damaged
- One is awaiting inspection
- One is serviceable and available to issue
then the maintenance team does not have five motors available for new demand.
Before measuring availability, define the inventory states clearly:
| Inventory state | What it means |
| Book quantity | Quantity recorded in the inventory system |
| Physical quantity | Quantity physically verified during the count |
| Serviceable quantity | Physically present inventory that meets the organization’s condition requirements for use |
| Reserved or allocated quantity | Serviceable inventory committed to a specific work order, project, or other demand |
| Available-to-issue quantity | Serviceable inventory that is not already allocated and can be issued to new demand |
| Blocked or quarantined quantity | Inventory physically present but temporarily unavailable because it requires inspection, disposition, or another control action |
| In-transit quantity | Inventory that has been shipped or transferred but has not yet been physically received at the destination |
This distinction matters because physically present does not always mean available for new maintenance demands.
Do not automatically treat reserved inventory as unusable. A reserved part may be fully serviceable and ready for the work order it was allocated to, but it is not available for a new requirement.
Measure usable availability separately
A practical operational measure is:
Usable availability = units meeting the defined available-to-issue criteria ÷ total physically verified units x 100
Using the example above:
1 available-to-issue unit ÷ 5 physically verified units = 20% available-to-issue share
The organization should define the exact meaning of “available-to-issue.” It may require the part to be physically present, correctly identified, serviceable, accessible, and not already allocated to another demand.
Keep this measure separate from inventory accuracy. An organization can have 100% quantity accuracy but only 20% available-to-issue inventory if most of its stock is reserved, damaged, awaiting inspection, quarantined, or otherwise unavailable for new demand.
That distinction helps maintenance leaders avoid a common mistake: assuming that an accurate inventory record automatically means the required part will be available when a technician needs it.
Step 4: Reconcile discrepancies with a variance log, then diagnose the cause
Reconciliation turns physical findings into corrective action.
Avoid ad hoc adjustments made bin by bin without documenting what changed and why.
Your variance log should capture:
- Item ID
- Manufacturer part number, where available
- Recorded quantity
- Counted quantity
- Unit of measure and conversion factor
- Baseline and count timestamps
- Recount result
- Counter and reviewer
- Adjustment reference and approval
- Recorded location
- Found location
- Site and storeroom
- Variance type
- Condition/status
- Initial reason code
- Owner
- Next action
- Approval, where required
Use a consistent variance taxonomy
| Variance type | What it usually means | What to check first |
| Quantity | More or less stock than expected | Receiving, withdrawals, returns, scrap |
| Location | Stock exists but is elsewhere | Putaway, transfers, point-of-use storage |
| Identity | Physical part doesn’t match record | Labels, duplicates, substitutions, kitting |
| UOM | Quantity is represented differently | Pack sizes, purchasing UOM, issue UOM |
| Status/availability | Part exists but cannot be issued to the intended demand. | Quarantine, damage, inspection, reservation |
| Condition | Part exists but is not serviceable | Damage, expiration, storage conditions |
| Ownership | Physical stock belongs to another party | Consignment or vendor-owned stock |
Don’t simply adjust the system to match the shelf
This is one of the most important audit controls.
If the system says 10 and the count says 8, the first question should not be:
“How do we change 10 to 8?”
It should be:
“Why are two units missing?”
Possible explanations include:
- Unrecorded issue
- Incorrect receipt
- Misplaced stock
- Scrap not transacted
- A return recorded before the part was physically received
- Transfer not recorded
- Duplicate record
- Parts consumed at point of use
Validate the discrepancy through recounts and transaction checks before posting an approved adjustment. If the root cause remains unresolved, correct the verified quantity with an exception record and keep the investigation open.
Add root-cause analysis for high-impact variances
Your variance log tells you what is wrong. Root-cause analysis tells you why it keeps happening.
Prioritize:
- Critical-spare discrepancies
- Repeated variance items
- Large financial exposure: Discrepancies involving significant inventory value, potential write-offs, or material financial impact.
- Variances that block maintenance
- Errors occurring across multiple locations
- Errors indicating a broken workflow
A simple 5 Whys analysis might look like this:
- Problem: A critical spare is repeatedly found in the wrong bin.
- Why? Putaway is not consistently recorded.
- Why? Employees place received or returned parts in temporary overflow locations when the assigned bin is full.
- Why? Those temporary locations are not represented in the inventory location structure.
- Why? No formal process exists to request and approve new or overflow inventory locations.
- Why? The location hierarchy is not governed through a defined inventory-control or management-of-change process.
- Root cause: The organization has no controlled process to create and govern inventory locations as storage needs change.
The corrective action should address both the immediate problem and the underlying control:
- Create controlled overflow locations and include them in the inventory location hierarchy.
- Require formal requests, approval, labeling, and system entry for every new or changed location.
- Assign an owner for location master data and review location changes periodically.
The goal of the 5 Whys is not to force exactly five questions. Keep asking why until the analysis reaches a controllable underlying cause, rather than stopping at the first visible symptom.
How to prioritize audit findings
A large audit can produce hundreds of discrepancies. Not all of them deserve the same response.
Use a simple prioritization model based on operational impact, recurrence, and financial impact.
| Finding | Operational impact | Recurrence | Suggested priority |
| Critical spare missing | High | Any | Immediate |
| Critical spare mislocated | High | Any | Immediate |
| High-value quantity discrepancy | Medium–High | Any | High |
| Repeated UOM error | Medium | Repeated | High |
| Duplicate low-value SKU | Low | One-off | Low–Medium |
| Obsolete low-value item | Low | One-off | Low |
| Point-of-use stock not recorded | Medium–High | Repeated | High |
The exact thresholds should be defined by your organization, but the principle is simple:
Prioritize discrepancies by the operational consequences they create, not just the number of units involved.
What a variance log looks like in practice
A variance log does not need to be complicated.
| Item ID | Mfr. part # | Recorded qty | Counted qty | Recorded bin | Found bin | Variance | Reason | Owner | Next action |
| SP-1042 | ABC-778 | 10 | 8 | A-02-04 | A-02-04 | Quantity | Suspected unrecorded withdrawal | Storeroom lead | Investigate WO issues and adjust after approval |
| SP-1187 | DEF-421 | 4 | 4 | B-01-02 | B-03-01 | Location | Mis-putaway | Storeroom lead | Correct bin and review putaway process |
| SP-2011 | XYZ-991 | 6 | 6 | C-02-01 | C-02-01 | Status | Quarantined | Maintenance lead | Update availability status |
Use actual item IDs and location names in the working version. Consistency matters more than complexity.
Step 5: Fix the inventory control gaps that create drift
Once you’ve categorized discrepancies and identified high-impact causes, implement corrective actions for the workflow gaps you found.
| Where drift starts | What it looks like | Control to implement |
| Receiving and putaway | Received stock is not placed in the recorded bin | Requires bin assignment and controlled putaway |
| Parts withdrawal | Inventory falls without traceable consumption | Link issues to work orders where possible |
| Returns | Returned parts never re-enter inventory | Record return, condition, status, and location |
| Transfers | Stock appears at the wrong site | Record outbound and inbound movement |
| Repairables/rotables | Parts disappear while at vendors | Track repair status, location, and expected return |
| Item master | Duplicate records or mismatched UOM | Establish master-data ownership and change control |
| Point-of-use inventory | Technicians hold unrecorded stock | Treat point-of-use areas as controlled locations |
| Obsolete/excess inventory | Stock remains after asset retirement | Review and route disposition decisions |
Your audit deliverable should include both:
- Corrected inventory records
- Control changes with owners, deadlines, and verification steps
Otherwise, the audit becomes a bulk adjustment rather than a control improvement.
Step 6: Connect spare parts to maintenance work orders
Inventory accuracy becomes much more useful when it is connected to the maintenance activity consuming the inventory.
The operational chain should look like this:
Asset → Work order → Required part → Issue → Inventory update → Maintenance completion → Asset history
Consider a pump requiring a replacement seal.
Without a connected workflow:
- Technician identifies the part.
- Storeroom issues the seal.
- Someone manually adjusts inventory later.
- The work order may not show the actual part consumed.
- The asset history may not clearly capture the replacement.
With a connected workflow:
- The work order identifies the asset.
- Required or used parts are associated with the work.
- The system issues the part from a known location.
- Inventory quantity updates as the transaction occurs.
- The maintenance record retains the part consumption.
- The asset’s service history provides context for future work.
That connection creates a much stronger audit trail.
When teams also record failure codes, parts-related delay reasons, and purchasing exceptions, linked records can help answer questions such as:
- Which assets consume the most spare parts?
- Which parts are repeatedly used for the same failure?
- Which work orders are delayed because a part is unavailable?
- Which assets are driving emergency purchases?
- Which spare parts should be stocked at particular sites?
- Are parts being consumed against the correct assets and work orders?
This is where spare parts management moves from a storeroom activity to part of the maintenance operating system.
Step 7: Review stocking thresholds and replenishment rules
An accurate count tells you what you have. It doesn’t tell you whether the quantity matches future maintenance demand.
After reconciliation, review:
- Historical consumption
- Demand variability
- Equipment criticality
- Lead times
- Supplier reliability
- Minimum and maximum levels
- Reorder points
- Safety-stock requirements
- Current maintenance plans
However, spare-parts demand is often intermittent rather than steady. A part may be used several times in one month and not at all for the next six months. This makes conventional stocking formulas less reliable when their assumptions don’t match the actual demand pattern.
For high-usage parts with relatively stable demand, conventional reorder-point or safety-stock methods may provide a useful starting point. For slow-moving or intermittent parts, teams should evaluate the assumptions behind those calculations rather than treating the resulting number as automatically appropriate.
For low-usage, high-criticality parts, the key question may be whether to hold the part at all. If a missing component could keep critical equipment offline for weeks or months, the cost of carrying an infrequently used spare may be justified by the potential cost of downtime. Conversely, holding an expensive part with a low likelihood of use may not make sense when a practical substitute or reliable expedited supply option exists.
For these parts, consider factors such as:
- Consequence of equipment downtime
- Probability and pattern of demand
- Part cost
- Lead time and lead-time variability
- Supplier reliability
- Availability of substitutes
- Equipment population and commonality
- Remaining useful life of the equipment
When standard formulas don’t adequately represent these conditions, organizations can use criticality-based, probabilistic, or other intermittent-demand approaches to inform stocking decisions. The appropriate method depends on the quality of the available demand and supply data.
The goal is not to maximize spare-parts inventory. The goal is to hold enough inventory to manage the operational risk of unavailability without creating unnecessary carrying costs or obsolete stock.
Review replenishment decisions after the audit
A recurring variance may reveal that the stocking policy itself needs attention.
For example, if a critical component repeatedly reaches zero before replenishment arrives, review whether the issue comes from inaccurate records, excessive demand, insufficient lead-time assumptions, an inappropriate reorder point, or a deliberate decision not to hold enough stock.
Do not automatically increase the stocking level. First determine whether the problem is inventory accuracy, demand, supply risk, or the stocking policy itself.
For critical spares, appropriate controls may include higher safety stock, a second supplier, a defined emergency-procurement path, a substitute part, or a decision to hold a dedicated unit. The right response depends on the operational consequence of being without the part.
Step 8: Keep accuracy from decaying with cycle counting
A one-time audit establishes a baseline. It does not keep the baseline clean.
After reconciliation, move to risk-based cycle counting.
Count high-risk inventory more frequently
Prioritize:
- Critical spares
- High-velocity items
- High-value items
- Repeat variance items
- Items with long lead times
- Inventory at high-risk locations
Count stable inventory less frequently
Lower-frequency counts may be appropriate for:
- Slow-moving items
- Low-risk inventory
- Stable locations
- Items with a strong history of accuracy
Document:
- Count schedules
- Variance tolerances
- Recount triggers
- Reason codes
- Escalation rules
- Ownership
- Closed-loop corrective action
A well-run cycle-counting program can reduce the need for disruptive wall-to-wall counts in some operating models, subject to applicable financial or external audit requirements.
Maintenance KPIs affected by spare parts accuracy
Don’t measure inventory accuracy only as a storeroom KPI.
Maintenance teams care about spare parts accuracy because inventory problems can affect equipment availability and work execution.
Track inventory measures alongside maintenance outcomes such as:
Maintenance delays caused by unavailable parts
Measure how often planned or corrective work is delayed because a required part cannot be found or issued.
Mean time to repair
If technicians spend less time waiting for parts or searching for inventory, spare parts controls can shorten repair cycles. Define whether your repair-time metric includes waiting for parts. Track parts-related waiting time separately so you can distinguish changes in active repair time from total restoration time.
Stockout-related downtime
Identify downtime events where the root cause includes an unavailable, mislocated, unidentified, or unusable spare.
Emergency purchases
Track purchases made outside normal replenishment because the expected inventory was unavailable.
Expedite and emergency freight costs
An inaccurate inventory record can turn a normal replenishment into an expensive expedited shipment.
First-time fix performance
Where appropriate, track whether technicians have the required parts when they start work.
Maintenance schedule compliance
If planned maintenance is repeatedly delayed because parts are unavailable, inventory control may be part of the underlying problem.
The goal isn’t to claim that better inventory accuracy automatically improves every maintenance KPI. Instead, connect the measures so you can identify where inventory failures affect maintenance execution.
Step 9: Measure whether the audit is improving performance
Once cycle counting is established, use metrics to determine whether accuracy is improving and whether the same problems are returning.
Define each metric clearly so the calculation cannot change from one reporting period to another.
Inventory line accuracy
Formula:
Number of counted inventory lines within the defined tolerance ÷ total inventory lines counted x 100
This measures inventory line accuracy: the percentage of counted item-location lines whose physical quantity falls within the organization’s predefined tolerance of the recorded quantity.
A line-level measure treats each counted line as one observation. It therefore does not show the magnitude or financial value of each discrepancy. A one-unit shortage and a 5,000-unit shortage can both count as one inaccurate line.
Depending on the purpose of the audit, organizations may also track:
- Quantity variance: counted quantity minus recorded quantity, expressed in the item’s defined unit of measure.
- Inventory value variance: quantity discrepancies valued using an agreed unit-cost basis.
- Absolute variance: the total magnitude of discrepancies, without letting positive and negative variances offset each other.
Use the measure that matches the question you are trying to answer. Line accuracy helps evaluate record reliability across inventory locations, while unit and value measures show the size and financial significance of discrepancies.
Location accuracy
Formula:
Lines found in the correct recorded bin ÷ total lines counted
A line refers to an SKU-location record.
Usable availability
Formula:
Units meeting the defined available-to-issue criteria ÷ total physically verified units
Define “available-to-issue” according to your organization’s inventory controls. It may require the part to be physically present, correctly identified, serviceable, accessible, and not already allocated to another demand.
Do not automatically treat reserved inventory as unusable. A reserved part can be fully serviceable and committed to a specific work order while remaining unavailable for new maintenance demand.
Track usable availability separately from inventory accuracy. This helps distinguish a quantity-record problem from a situation where inventory exists but maintenance can’t issue it when needed.
Stockouts by cause
Separate:
- True stock shortages
- Record errors
- Mislocated inventory
- Incorrect status
- Unusable condition
This distinction helps identify whether the problem is purchasing, inventory control, or maintenance planning.
Cycle-count completion rate
Formula:
Items or bins counted as planned ÷ items or bins scheduled
Recurring variance tracking
Track how frequently the same items, locations, or processes generate discrepancies.
Maintenance impact
Where data is available, also track:
- Work orders delayed by parts
- Stockout-related downtime
- Emergency purchases
- Expedite costs
- Repair delays caused by inventory issues
Segment metrics by site, part class, criticality, and usage behavior. Aggregate metrics can hide the risks that matter most.
Where EAM or CMMS software can help
Your system of record may be an enterprise asset management (EAM) system, computerized maintenance management system (CMMS), ERP inventory module, or a combination of systems.
The key question isn’t whether the software stores inventory quantities.
Ask whether it links inventory transactions to the maintenance workflow.
Where EZO EAM can support spare parts control
Disclosure: EZO publishes this article and develops EZO EAM.
For maintenance and storeroom teams, EZO EAM can support several of the controls described in this audit process:
- Track spare parts and consumables by location so teams can see stock quantities across sites and storerooms.
- Configure low-stock and location-based thresholds and enable the corresponding alerts to flag quantities below defined levels.
- Transfer inventory between locations while maintaining a record of the movement.
- See available inventory at a technician’s location when adding inventory to a maintenance work order.
- Record parts used against maintenance work orders, connecting inventory consumption with maintenance activity.
- Link purchase orders to open work orders so teams can track maintenance-related procurement.
- Combine inventory, purchasing, vendor, receipt, and usage information to give maintenance and operations teams more context on parts availability and replenishment.
These capabilities can connect spare-parts records with maintenance execution, but they don’t replace audit controls. Teams still need defined counting procedures, ownership, variance tolerances, criticality rules, and corrective-action processes.
Note: Work order functionality requires an eligible CMMS-enabled subscription. Inventory, purchasing, and transfer capabilities also depend on plan and configuration.
Use the audit as a software evaluation checklist
The following questions are vendor-neutral evaluation criteria, not a list of EZO EAM capabilities. When evaluating any EAM or CMMS platform, ask the vendor to demonstrate how the system handles:
- Finding a part by site and storage location
- Verifying current stock and availability
- Recording a part withdrawal against a maintenance work order
- Updating inventory after a part is consumed
- Recording transfers between locations
- Handling returned, damaged, quarantined, or otherwise unavailable inventory
- Maintaining traceability between parts, work orders, and assets
- Reporting on inventory discrepancies and parts-related maintenance delays
This distinction matters because inventory-control requirements and software capabilities are not the same thing. A process may require a specific control even when a platform doesn’t automate it natively.
Close the audit with a control check
Before closing the audit, confirm that the findings have been converted into corrective actions rather than simply inventory adjustments.
Use this short closeout checklist:
- Reconciled: Investigate and resolve discrepancies in material quantity, location, identity, condition, and status.
- Root cause identified: Significant or recurring variances have an identified underlying cause.
- Ownership assigned: Each control gap has an owner and a target completion date.
- Records corrected: Inventory, location, unit-of-measure, and ownership records have been updated and approved.
- Controls strengthened: Implemented required process, system, labeling, training, or governance changes.
- Follow-up defined: High-risk findings have a scheduled recount, cycle count, or control review.
- Results measured: Monitor accuracy, availability, stockouts, and maintenance-related outcomes after corrective actions.
The audit is ready to close when the organization can explain the material discrepancies, document what changed, and show how the new controls address the causes and how their effectiveness will be verified.
Closing the loop
A spare parts audit creates value when it changes what happens after the count. The most important findings should lead to corrected records, stronger controls, assigned ownership, and follow-up checks that verify the problem has actually been addressed.
The goal is not a perfect count once a year. It is a controlled inventory process that gives maintenance teams confidence they can identify, locate, and issue the parts they need when required.
That is where connected asset and maintenance workflows can help. When spare-parts records are tied to maintenance work, asset history, purchasing, and inventory movements, teams have more context to understand both inventory discrepancies and their operational impact.