
Key Takeaways:
- Equipment fleet utilization measures how effectively rental businesses use their equipment to generate revenue and maximize fleet productivity.
- Time utilization and financial utilization are the two primary metrics for evaluating rental activity and revenue relative to equipment investment.
- Poor fleet utilization often results from inaccurate availability records, booking gaps, maintenance downtime, delayed returns, and uneven demand across locations.
- Improving utilization requires better reservation planning, faster rental turnaround, preventive maintenance, strategic equipment allocation, and demand-based pricing.
- Higher utilization doesn’t always mean higher profitability. Rental businesses must evaluate revenue, operating costs, and equipment performance together.
- Rental management software like EZRentOut connects equipment availability, rental orders, maintenance, and reporting to support informed fleet decisions.
For equipment rental businesses, fleet utilization directly influences revenue, operational efficiency, and profitability. Yet keeping a rental fleet productive can be challenging when equipment sits idle between bookings, returns take longer than expected, or high-demand assets aren’t available when customers need them.
Expanding the fleet isn’t always the answer. Rental businesses can often improve performance by using the equipment they already own more effectively. This requires balancing customer demand, equipment availability, maintenance needs, and rental costs without compromising service quality.
In this guide, we’ll explore practical strategies to improve equipment fleet utilization, measure fleet performance, and make informed decisions that help rental businesses generate more value from their existing inventory.
What is equipment fleet utilization?
Equipment fleet utilization measures how effectively a rental business uses its equipment to generate revenue over a given period. It indicates how much of the fleet’s available capacity is actively rented rather than sitting idle.
For rental businesses, utilization has two important dimensions:
- Time utilization measures the proportion of the reporting period equipment spends rented.
- Financial utilization evaluates rental revenue relative to equipment acquisition costs.
Together, these metrics help assess fleet productivity and revenue performance relative to equipment investment.
How do you calculate equipment fleet utilization?
As discussed above, equipment fleet utilization is measured using two key metrics: time utilization and financial utilization. Infor documents separate time, weighted time, and financial utilization measures. The examples below state the calculation basis used in this guide; product reports may apply different treatment of out-of-service time. Here’s how to calculate these metrics using practical examples.
Time utilization formula
For the calendar-day measure used here, time utilization is the percentage of fleet days spent on rent. Each unit contributes calendar days while included in the reporting fleet. Keep maintenance and other off-rent days in this denominator. If you also calculate utilization against serviceable capacity, label that measure separately. For a group of similar equipment, a simple unit-day calculation provides a useful starting point.
Simple (unweighted) time utilization (%) = (Total days on rent ÷ Total fleet days in the measurement period) × 100
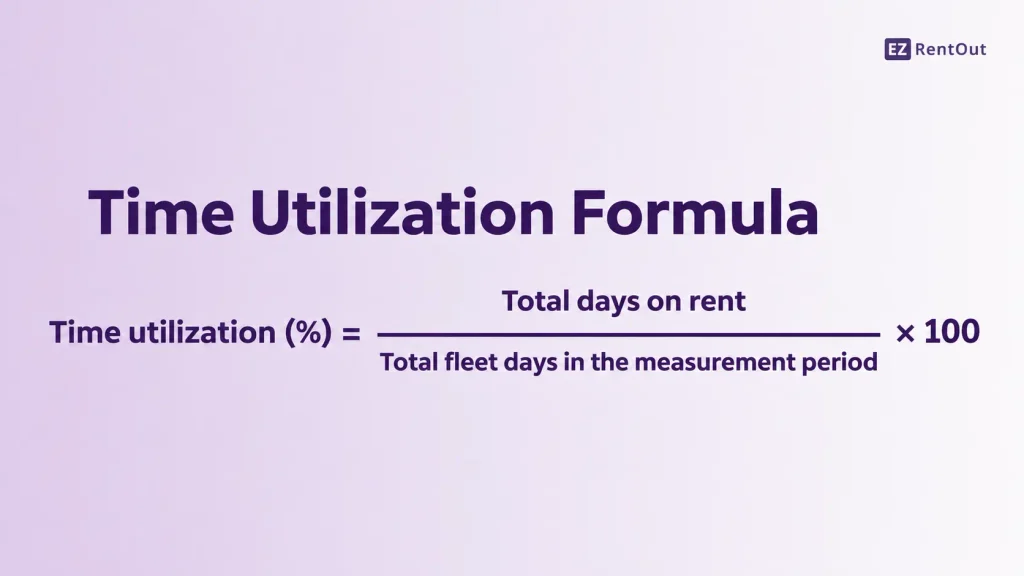
For example, consider a rental business with 20 machines over a 30-day period:
- Total fleet days: 20 × 30 = 600 days
- Combined days on rent: 390 days
- Time utilization: (390 ÷ 600) × 100 = 65%
This means the fleet spent 65% of the measurement period on rent. However, the unweighted formula treats every unit equally, regardless of value.
Define an on-rent day consistently. Under the ARA daily convention, a unit in the renter’s control and earning rental revenue during any part of a calendar day counts as one on-rent day, with a maximum of one per unit per day.
For mixed-value fleets, report OEC-weighted time utilization alongside unit-day utilization and category-level results. Original equipment cost (OEC) weighting accounts for differences in equipment investment, so a low-cost tool contributes less to the fleet-wide result than an expensive excavator.
OEC-weighted time utilization (%) = [Σ (Each asset’s OEC × its days on rent) ÷ Σ (Each asset’s OEC × its fleet days in the period)] × 100
For example, suppose a $5,000 tool is on rent for 24 days and a $150,000 excavator is on rent for 12 days during the same 30-day period:
- Simple (unweighted) utilization: (24 + 12) ÷ 60 × 100 = 60%
- OEC-weighted utilization: [(5,000 × 24)+(150,000 × 12)] ÷ [($5,000 + $150,000) × 30] × 100 = 41.3%
The difference shows why a simple unit-day average can report a higher result than the OEC-weighted measure when higher-cost equipment spends less time on rent.
Use a consistent measurement period and document how you treat equipment added or removed mid-period, planned maintenance, and other unavailable days. If you exclude such days from the denominator, disclose the criteria so results remain comparable.
Financial utilization formula
Financial utilization, also called dollar utilization, measures annualized equipment rental revenue relative to the fleet’s original equipment cost (OEC). For fleet-wide reporting, use average OEC over the measurement period rather than the cost recorded on a single date. Calculate average fleet OEC using daily fleet balances, or an equivalent time-weighted method that accounts for additions, disposals, and qualifying cost changes.
Financial utilization (%) = (Annualized eligible rental revenue ÷ Average fleet OEC for the same period) × 100
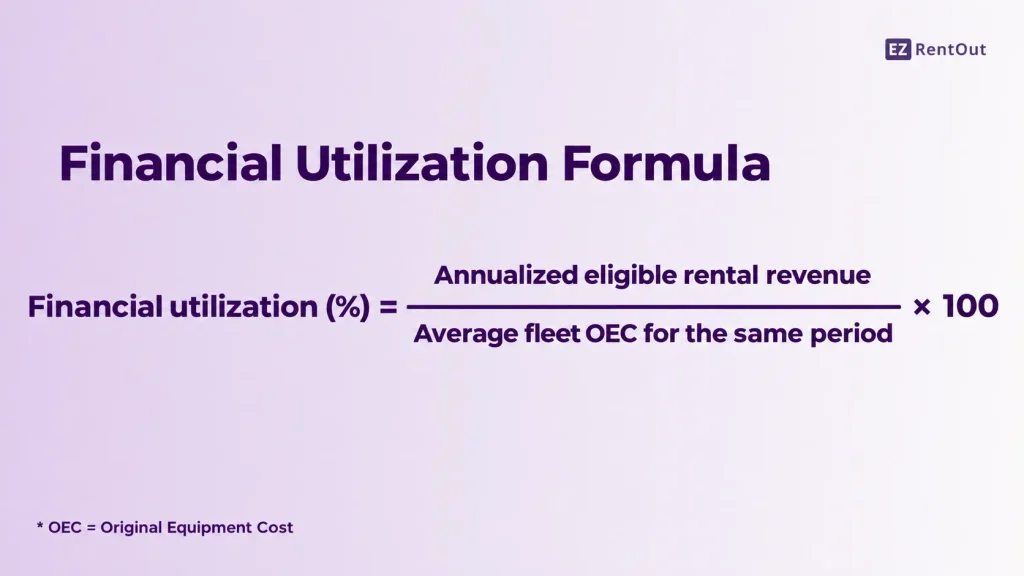
Include only revenue earned from renting the business’s own equipment. Exclude delivery and pickup charges, damage waivers, environmental fees, and re-rent revenue from equipment sourced from other rental providers. For example, if an invoice includes $20,000 in equipment rent and $3,000 in delivery and other fees, only $20,000 counts toward financial utilization.
OEC is the equipment’s original, undepreciated acquisition cost, including qualifying capitalized refurbishments, not its current depreciated book value. For a changing fleet, additions, disposals, and qualifying capital improvements affect OEC, so use the average OEC for the reporting period and follow a consistent capitalization policy.
For example, assume a static fleet with average OEC of $500,000 generates $200,000 in eligible equipment rental revenue over the past 12 months:
Financial utilization = ($200,000 ÷ $500,000) × 100 = 40%
A trailing 12-month (TTM) calculation is useful for ongoing reviews because it includes a full seasonal cycle. If reporting over a shorter period, annualize the eligible revenue first. For example:
Annualized revenue for a 90-day period = Eligible rental revenue × (365 ÷ 90)
Then divide by the average OEC for those 90 days. Short-period annualization is a comparison convention, not a forecast, and can be misleading for highly seasonal fleets.
Financial utilization is not net profit: it does not deduct maintenance, depreciation, insurance, financing, or other operating expenses. Evaluate profitability separately before making fleet investment decisions.
What is a good equipment fleet utilization rate?
There is no single ideal utilization rate for every rental business. Appropriate targets depend on several factors:
- Equipment category: Frequently rented tools and specialized heavy machinery have different demand patterns.
- Fleet composition: Businesses with diverse equipment categories may experience varying utilization across asset groups.
- Seasonality: Construction and outdoor equipment rentals often fluctuate with weather and project schedules.
- Customer demand: Local market conditions, rental duration, and booking frequency influence achievable utilization.
Rather than pursuing a fixed industry-wide percentage, rental businesses should set category-specific targets based on historical performance, demand patterns, and equipment costs.
What causes poor equipment fleet utilization?
Poor fleet utilization often stems from operational inefficiencies that affect how much time equipment spends on rent, the revenue it generates, or both. Common causes include:
- Inaccurate availability records: Incorrect equipment statuses can lead to missed bookings, reducing time utilization.
- Idle time between bookings: Extended rental gaps lower the proportion of days equipment generates revenue, affecting both utilization metrics.
- Long return turnaround times: Delayed inspections, cleaning, or return processing reduce rentable days and potential rental revenue.
- Unplanned maintenance: Unexpected breakdowns interrupt rental availability, lowering time utilization and potentially financial utilization.
- Uneven demand across locations: Equipment sitting idle at one branch while another faces shortages reduces overall fleet utilization.
- Overinvestment in low-demand equipment: Excess fleet capacity lowers time utilization and can weaken financial utilization by increasing equipment investment without proportional rental revenue.
9 strategies to improve equipment fleet utilization
Improving equipment fleet utilization requires targeted changes to how rental businesses manage equipment demand, availability, maintenance, and fleet investment. The following nine strategies can help increase productive rental time and generate better financial returns from existing equipment.
1. Track utilization by asset and equipment category
Start by analyzing rental activity at both the individual asset and equipment-category levels. A category may appear to perform well overall while certain units remain consistently underutilized.
Compare rental days across similar assets and identify equipment with repeated booking gaps. Segment these findings by equipment type, age, and rental location to understand whether low utilization is isolated or widespread.
This helps managers distinguish between equipment with consistently strong demand and assets that may require reassignment, pricing adjustments, or retirement.
2. Improve equipment availability and reservation planning
Rental opportunities can be lost when equipment is physically present but already committed, incorrectly marked unavailable, or difficult to allocate.
Maintain an up-to-date availability calendar that accounts for existing reservations, expected returns, and upcoming rentals. Review booking gaps to identify opportunities for shorter rentals between longer commitments.
For frequently requested equipment, establish realistic booking buffers. Verify return dates and turnaround buffers, and resolve any overlap before confirming the next booking. Better scheduling can increase rentable days without expanding fleet capacity.
3. Reduce equipment turnaround time between rentals
The time between receiving returned equipment and preparing it for the next customer represents an opportunity to recover rental capacity.
Establish a standardized return process covering condition inspections, accessory verification, cleaning, and functional checks. Assign responsibility for each stage and prioritize equipment with upcoming reservations.
Track the time between customer return and rent-ready status to identify processing bottlenecks. Shortening this interval can make equipment available sooner while maintaining quality and safety standards.
4. Schedule preventive maintenance around rental demand
Maintenance planning should account for equipment usage, manufacturer recommendations, and upcoming rental commitments.
Use operating-hour meter readings or calendar-based service intervals to anticipate maintenance requirements. Where service windows are flexible, schedule routine work during periods of lower demand rather than immediately before confirmed bookings.
For equipment with heavy rental activity, coordinate replacement units or alternative scheduling arrangements before planned servicing. This reduces avoidable disruption while ensuring equipment receives necessary maintenance.
5. Redistribute equipment across rental locations
Rental demand rarely remains consistent across every branch. Equipment that receives few bookings at one location may be in high demand elsewhere.
Compare location-level rental activity, reservation backlogs, and available inventory to identify potential redistribution opportunities. Before transferring equipment, assess transportation costs, expected rental revenue, and demand at the originating location.
For recurring demand shifts, establish a planned equipment-transfer schedule rather than relying solely on emergency relocations.
6. Use rental demand trends to optimize fleet size
Fleet size decisions should reflect both completed rentals and qualified demand that the business could not fulfill. High utilization combined with repeated shortages may support expansion, but low utilization alone does not mean you should sell equipment.
Review historical bookings, seasonal demand, reservation conflicts, and qualified lost requests: unique, genuine rental requests you could not fulfill because suitable equipment was unavailable. For each request, record a unique ID, equipment category and quantity, requested rental dates, quoted rate, reason for nonfulfillment, and final outcome. Deduplicate repeat quotes and inquiries across channels. Call the quoted amount opportunity value, not realized lost revenue; it does not establish that every request would have converted.
Segment the fleet before making purchase or disposal decisions:
- Core fleet: Equipment with recurring demand and positive net contribution. Prioritize availability, reliability, and timely replacement.
- Seasonal fleet: Equipment needed mainly during predictable peaks. Compare equivalent seasons, not just annual utilization averages.
- Emergency standby: Equipment retained to meet urgent customer commitments or cover breakdowns. Protect a documented minimum reserve even if routine utilization is low.
- Chronically idle fleet: Equipment with limited demand and no essential standby role. Investigate transfers, pricing changes, or disposal.
For temporary shortages, assess cross-branch transfers or short-term re-rentals before purchasing. Before disposing of any unit, compare its net contribution (rental revenue less attributable operating costs), expected repair needs, residual or resale value, service-level impact, and replacement lead time. The objective is to match fleet investment to sustainable demand without removing capacity needed to fulfill critical commitments.
7. Optimize equipment rental pricing and discount strategies
Higher booking frequency does not automatically translate into stronger financial utilization, particularly when equipment is consistently rented at heavily discounted rates.
Review realized rental revenue alongside booking frequency, rental duration, and equipment category. Identify whether weekly or monthly pricing, seasonal offers, or long-term rental agreements could improve revenue from available capacity.
Before offering discounts to increase bookings, account for maintenance, transportation, and other rental-related costs. Pricing decisions should support financial returns rather than increase utilization at the expense of profitability.
8. Improve equipment visibility and tracking
Reliable equipment location and status information helps rental teams identify which physical units can fulfill upcoming orders.
Record equipment movements during dispatch, customer returns, branch transfers, and maintenance handoffs. Barcode or QR code scanning can help teams update the correct equipment records at each stage.
For fleets operating across multiple yards or job sites, consistent check-in and check-out procedures reduce the risk of misplaced, misclassified, or overlooked equipment when allocating rental orders.
9. Monitor fleet performance and make data-driven decisions
Establish a regular fleet review process that connects utilization performance with measurable operational decisions.
Compare time and financial utilization against historical results and category-specific targets. Supplement these findings with maintenance costs, equipment age, and rental revenue to evaluate each asset’s overall performance.
Use the results to determine appropriate actions:
- High demand and strong returns: Prioritize availability and assess whether additional capacity is justified.
- Repeated qualified shortages: Check scheduling, maintenance, and nearby branch inventory before treating missed requests as proof that new equipment is needed.
- High rental activity but weak financial returns: Reassess pricing and attributable operating costs.
- Low utilization with demand at other branches: Evaluate relocation, including transfer cost and future local demand.
- Low utilization in essential standby equipment: Maintain the reserve needed for service commitments and realistic replacement lead times.
- Low utilization and weak contribution without a standby role: Compare repair outlook, resale proceeds, and service-level risk before disposal or fleet downsizing.
Assign owners and review the results of each action in subsequent reporting periods. This turns utilization reporting into an ongoing fleet optimization process rather than a standalone performance measurement exercise.
Which KPIs should rental businesses track to improve fleet utilization?
Beyond time and financial utilization, rental businesses need operational KPIs to understand where they lose rental capacity and revenue opportunities. Tracking these metrics together helps identify performance gaps that utilization percentages alone may not reveal.
| KPI | What it measures | Why it matters |
| Time utilization | Percentage of fleet capacity spent on rent | Indicates how effectively available rental days are used |
| Financial utilization | Annualized eligible equipment rental revenue as a percentage of average fleet OEC | Shows revenue performance relative to fleet investment |
| Equipment idle time | Time equipment is rent-ready but not on rent; distinguish uncommitted idle time from time held for confirmed reservations | Reveals unused capacity and gaps between bookings |
| Fleet downtime | Time equipment is unavailable due to maintenance or repairs | Separates service-related unavailability from lack of rental demand |
| Rental turnaround time | Time between equipment return and rent-ready status | Highlights delays that reduce rental availability |
| Revenue per asset | Rental income generated by each equipment unit | Helps compare earning performance within equipment categories |
| Qualified lost requests | Unique, valid equipment requests unfulfilled due to lack of suitable available units | Exposes demand missing from completed rental metrics; exclude duplicate inquiries and customer-driven cancellations |
| Request fill rate | (Fulfilled qualified rental requests ÷ all qualified rental requests) × 100 | Shows how consistently the fleet meets actual demand by category and location |
Count each customer need once, even if it generates multiple quotes. Record why an unfilled request was lost, and distinguish stockouts from price objections or customer cancellations. Use quoted amounts as opportunity value, not confirmed lost revenue. Match fulfillment outcomes to unique request IDs; count fully fulfilled requests against qualified requests due for fulfillment in the same reporting cohort. It is a recommended management KPI, not a claim that EZRentOut automatically calculates.
Review these KPIs by equipment category and rental location, using consistent reporting periods. This makes performance comparisons more meaningful and helps managers distinguish temporary fluctuations from persistent inefficiencies.
How EZRentOut helps improve equipment fleet utilization
EZRentOut connects equipment reservations, rental orders, asset tracking, maintenance, and rental revenue and operational reporting in one platform. This gives rental businesses a consistent view of equipment activity from initial booking through return, plus the data needed to evaluate fleet performance.
Here’s how its capabilities support equipment utilization:
- Asset Optimizer: Tracks equipment utilization and return on investment (ROI), helping managers identify underperforming assets and decide whether to retain, relocate, or replace them. Confirm the calculation basis of each product report before comparing it with the formulas in this guide.
- Availability Calendar: Displays available, reserved, checked-out, overdue, and under-maintenance equipment for selected dates, helping teams assess rental capacity before confirming orders.
- Rental order management: Keeps reservations, extensions, equipment swaps, partial returns, and billing changes connected to the same rental order, reducing gaps between operational and financial records.
- Maintenance management: Links service records, recurring maintenance schedules, and work orders to equipment. Assets placed in maintenance are unavailable for rent-out; future bookings may still be allowed when their dates do not overlap the maintenance period.
- Multi-location reporting: Consolidates equipment activity, utilization, and revenue data across rental locations, allowing managers to compare fleet performance without manually combining separate records.
Note: Feature availability depends on the subscription and configuration. Work Orders are listed under Premium, while support for multiple sites is listed under Enterprise.
EZRentOut also provides revenue tracking and custom reports, allowing rental businesses to examine equipment usage alongside financial performance. By connecting these records, managers can investigate whether an underperforming asset has insufficient rental activity, generates limited revenue, or incurs frequent maintenance interruptions.
This helps turn everyday rental transactions into actionable information for equipment allocation and fleet investment decisions.
Conclusion
A well-utilized equipment rental fleet is not necessarily the busiest one. Equipment that remains constantly booked but generates insufficient revenue or incurs excessive maintenance costs may still be a poor investment.
The real measure of success is whether each asset contributes to the business’s financial and operational goals. Regular performance reviews, backed by reliable rental and cost data, help businesses recognize when to expand capacity, adjust pricing, or phase out underperforming equipment.
With EZRentOut, rental businesses can connect equipment activity with financial insights and make these decisions with confidence. Ultimately, improving equipment fleet utilization means building a fleet that responds to customer demand while delivering sustainable returns.