




EZRentOut Rental Business Intelligence
Rental Business Intelligence Software
Rental Intelligence, Built for Business Growth
Track utilization, ROI, revenue, AR, and lost business in one place. EZRentOut turns the rental data already in your system into clear reporting, so you can see what earns, what sits idle, and where to act.
Our Clients Reported
1.2M
Customers Managed Seamlessly
22%
Quarterly Revenue Growth
3.1M
Orders Created with Ease
Turn Rental Activity Into Smarter Business Decisions
Clearer Fleet Utilization & ROI
See which units are earning and which are sitting idle. Track utilization and asset ROI across the fleet so equipment decisions are based on actual rental activity.
Stronger Revenue & AR Visibility
Track rental revenue over time and see what customers owe. AR aging and overdue-payment views help finance and rental teams quickly spot balances that need attention.
Better Conversion & Sales Insight
See which opportunities didn't convert and how monthly conversions change over time. Use lost-business data and the opportunity pipeline to focus follow-up efforts.
Rental Reporting Across Locations
Build custom reports with graphs and schedules, review customers, staff, equipment, and trends, and combine reporting across stores and locations in one clear view.
We're Trusted by the Best


See Your Rental Business More Clearly
See the Numbers Behind Every Rental Decision
Fleet Utilization and ROI
Revenue & AR Visibility
Lost Business & Conversion
Custom & Multi-Store Reports
Fleet Utilization and ROI
Know Which Units Earn and Which Sit Idle
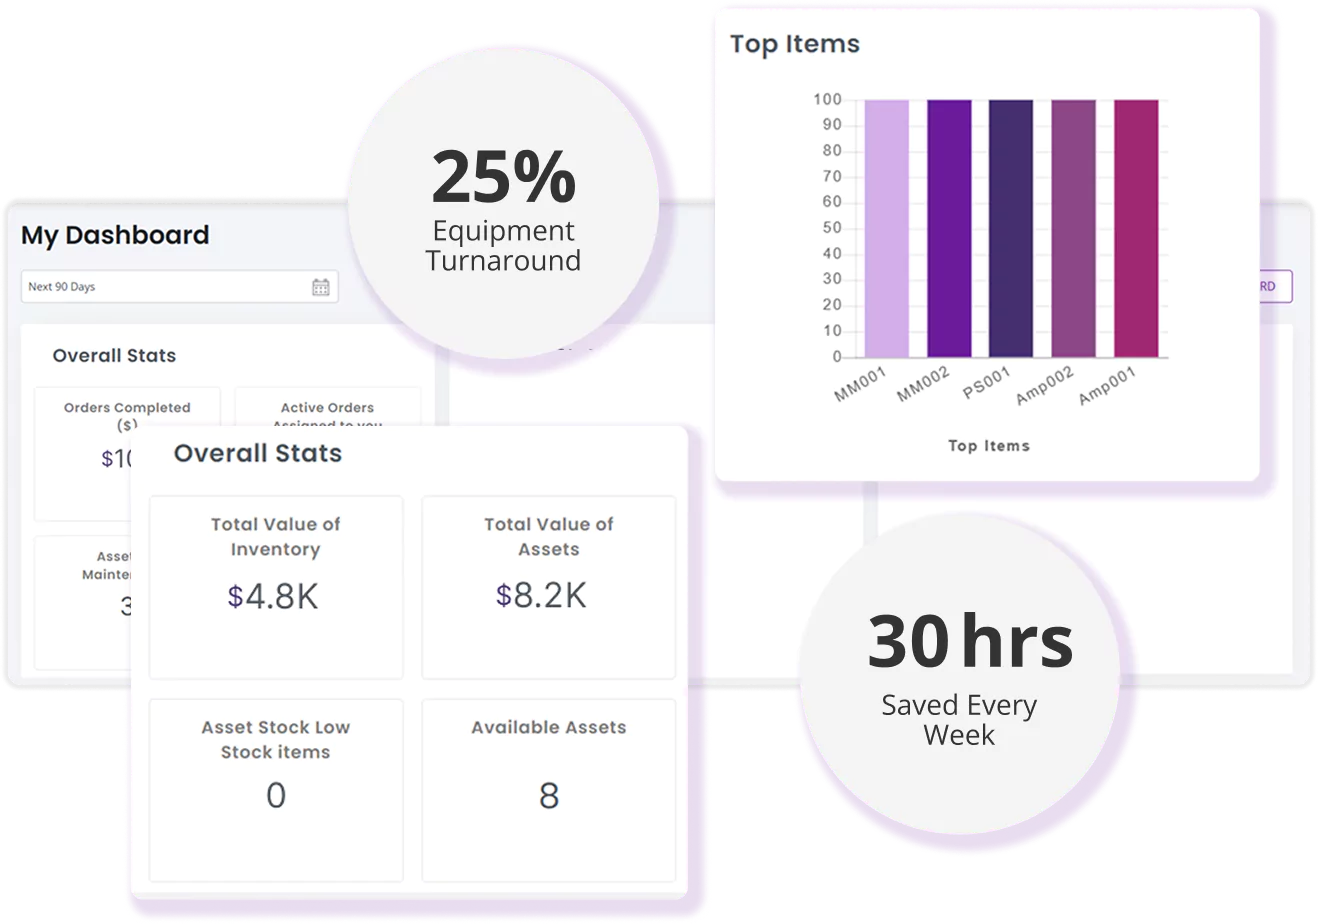
Asset Optimizer tracks utilization and ROI across your fleet so you can compare which units are working and which are sitting idle. Use rental-meter and usage data to spot underperforming equipment, balance use across the fleet, and support buy, keep, move, or sell decisions with evidence from the rental activity EZRentOut records daily.
Revenue & AR Visibility
Keep Rental Revenue and Receivables in View
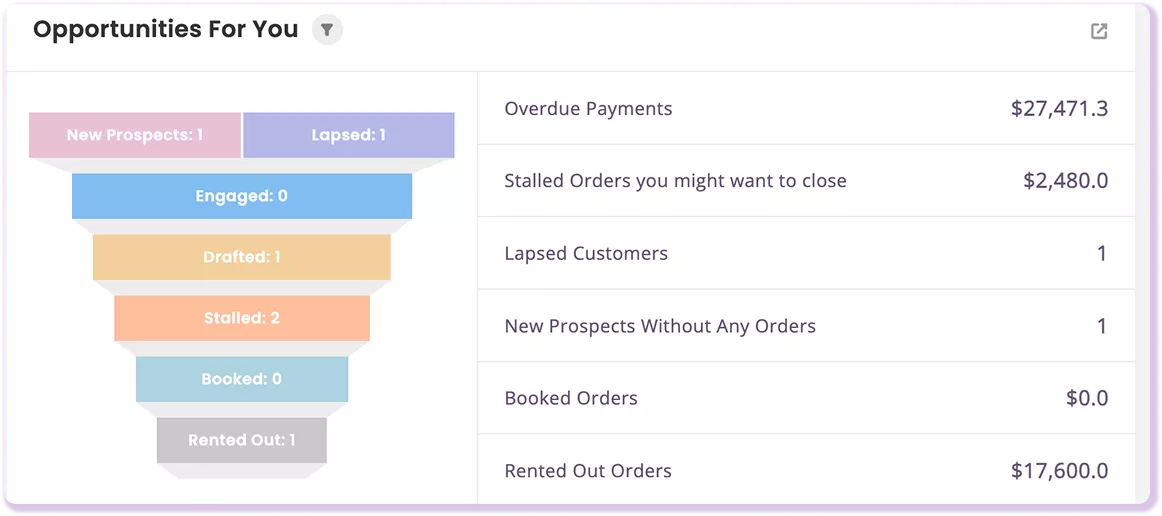
Revenue Tracking shows what your rental business earned over time, while AR aging shows what customers owe and how late balances are. Use overdue and pending-payment views, filters, and order listings to find rentals that need attention, then pair revenue visibility with asset ROI for a clearer picture of financial performance across your business.
Lost Business & Conversion
See Where Rental Opportunities Are Lost
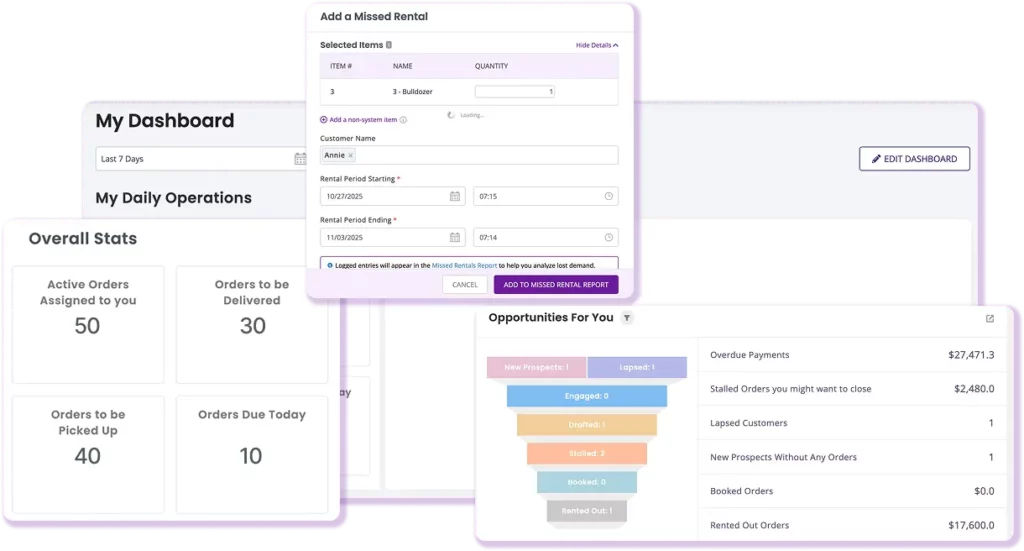
Lost Business reporting captures opportunities that did not convert, while monthly Order Conversion Cohort Analysis shows how conversion changes over time. Review where deals are lost, compare conversion patterns between cohorts, and give sales and rental teams clearer evidence of where follow-up or process changes can improve future orders.
Custom & Multi-Store Reports
Build Reports Around the Way You Operate
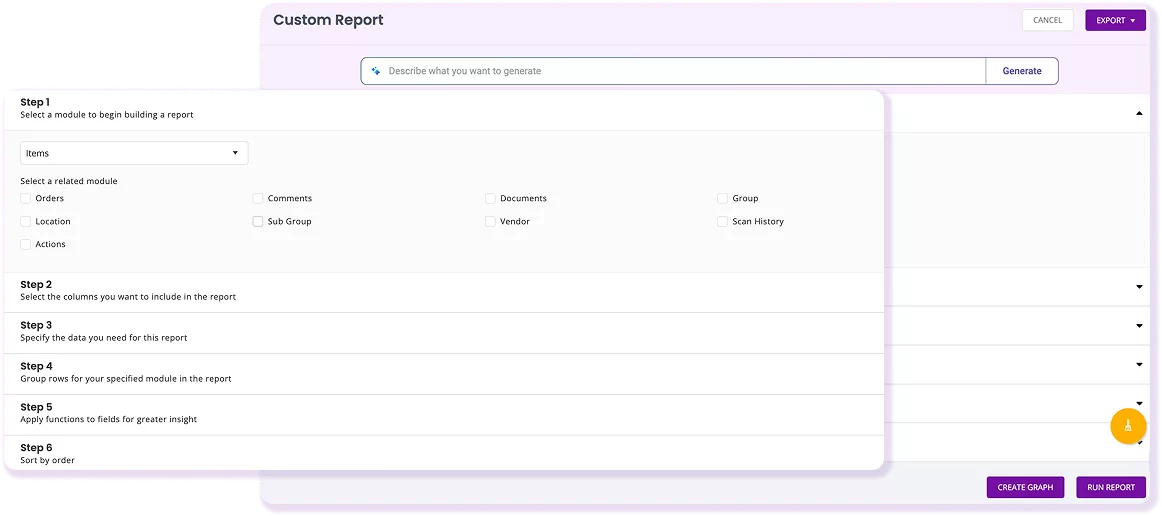
Create Custom Reports beyond the standard set, add graphs, and schedule recurring delivery for the teams that need them. Reports & Analytics cover customers, staff, equipment, and trends; the History Trail records changes across key records; and multi-store reporting combines activity across stores and locations into one broader operating view.
Proven results by our customers
OPERATIONAL EFFICIENCY GAIN
“All my invoicing and all my payments get pushed over there, so I don’t have to physically do that anymore.”
SAVED PER YEAR
“You can save over 2,000 hours per year with EZRentOut. There is nothing comparable.”
REDUCTION IN COSTS
“[EZRentOut] decreases the amount of rework, chasing down the equipment, and knowing whether or not we’ve done the maintenance”
See What Better Rental Visibility Looks Like
Confidence Built on Results
4.5/5
G2 Overall Sentiment
0 (Difficult)
10 (Easy)
<1 Day
>12 Months
<6 Months
Frequently Asked Questions
EZRentOut provides rental-specific reporting across utilization, ROI, revenue, AR, customer activity, equipment usage, and business trends. Asset Optimizer helps track equipment utilization and ROI, while Revenue Tracking, AR aging reports, Lost Business reporting, Order Conversion Cohort Analysis, and Custom Reports provide additional visibility. Teams can build reports with graphs and scheduling to review rental performance using the operational data already stored in EZRentOut.
Yes. EZRentOut uses Asset Optimizer to track equipment utilization and ROI across your rental fleet. Rental owners and operations teams can identify which units are generating activity, which equipment is sitting idle, and where usage is uneven. Rental Meter and asset usage tracking support this visibility, helping teams decide on equipment allocation, purchasing, retention, or replacement based on rental activity.
Yes. EZRentOut provides Revenue Tracking to show rental earnings over time and combines that visibility with asset ROI data from Asset Optimizer. Rental businesses can review financial performance alongside equipment activity instead of looking at revenue and asset information separately. For more specific reporting needs, Custom Reports let teams create additional views using rental data already in the system.
Yes. EZRentOut supports multi-store reporting, allowing equipment rental businesses to combine information across locations into a broader reporting view. Multi-location operators can review rental activity across stores instead of managing separate reports for each branch. This helps owners and operations teams understand network performance while keeping rental, customer, equipment, and financial information connected.
Yes. EZRentOut includes Lost Business reporting and Order Conversion Cohort Analysis to help rental teams understand missed opportunities. Lost Business reporting captures rentals that did not convert, while monthly conversion cohorts show how conversion changes over time. These insights help teams review where opportunities are slipping and identify areas where sales and equipment rental processes may need attention.
Yes. EZRentOut includes Custom Reports that let teams create reports beyond the standard options, add graphs, and schedule reports for recurring review. Reports & Analytics cover customers, staff performance, equipment usage, and trends. These capabilities help rental businesses create views that match their operational needs without manually rebuilding information from multiple systems.
No. EZRentOut provides native rental reporting and analytics using the rental data already stored in the platform. Businesses can review utilization, ROI, revenue, AR, lost business, and operational trends without moving rental information into a separate analytics environment. EZRentOut is rental management software with built-in reporting, not a standalone business intelligence platform.
EZRentOut pricing is based on the EZRentOut platform plan, not a separate business intelligence product. Reporting capabilities are included within the rental management platform, with specific features available depending on the plan. For example, Custom Reports are included in Growth. Businesses evaluating advanced reporting needs should confirm feature availability based on their operational requirements and selected plan.
EZRentOut implementation depends on the size of the rental operation, existing data, and the workflows being configured. Teams typically begin by setting up rental items, customers, orders, reporting preferences, and user access. Businesses can use EZRentOut’s onboarding resources and customer support to configure the platform around their rental workflows and reporting requirements.
Explore More Rental Business Insights
Run Your Rental Business With Clear Insights
See utilization, revenue, AR, lost business, and rental performance in one place.