Data insights are crucial if you want your business to succeed and want to keep a bird’s eye view over your IT assets and their utilization. Our Custom Reports provide you with access to more in-depth data and greater customizability — all from one place.
You can identify connections between different data sets, and get specific with details important to your business workflow.
1. Getting started
You can enable Custom Reports by going to Settings → Add Ons → Custom Report, selecting ‘Enabled’, and clicking ‘Update’.

To get started, go to the Reports → Custom Reports → Custom Report. You can also click on the ‘Create Report’ button on the top right of the Reports page to be taken directly to the Custom Report page.
Here, you can build your Custom Reports from scratch. Before we get into that, let’s take a look at the buttons highlighted below.

- Load Saved Report: Load a report you previously saved.
- View Scheduled Report: View any reports you’ve scheduled within this category.
- Export: Download this report as a CSV, PDF or upload it to Dropbox/OneDrive directly from this page.
AssetSonar enables you to create and run Custom Reports for different modules — that also includes your hardware and software Assets.
2. Creating custom reports for hardware assets
Step 1: Selecting a module
Start off by selecting a primary module for your report. Here’s a look at the primary modules you can choose for your Custom Report:

To generate a report for the usage of hardware Assets, you need to select the module labeled ‘Assets’.
Next, you can select one or more related modules. As implied by the name, these will change based on your initial selection. For example, choosing ‘Asset Transfer History’ allows you to choose from related modules such as Location, Custodian, Group, Vendor, and so on.
Say, we want to run a report on the transfer of hardware Assets e.g. laptops across different job-sites for different projects. For that, we’ll select ‘Asset’ as the primary module. That results in the following related modules:

For the purposes of our report, we’ve chosen ‘Asset Transfer History’, ‘Location’, and ‘Custodian’. The related modules you select here will open up additional choices to you in Step 2.
Note: As you can see, two related modules (‘Comments’ and ‘Documents’) are greyed out in the image above. Some related modules can have multiple associations with a single item. As an example, one laptop can be associated with multiple Comments, Documents, and Carts. When setting up a report, you cannot select more than one of these related modules. In the image above, we’ve already selected Asset Transfer History, which is why the other two multi-association modules have been greyed out.
Step 2: Selecting columns
For step 2 to appear, click the ‘Continue on choosing columns’ link. In the step above, we chose the primary module ‘Asset’, with the related modules ‘Asset Transfer History’, ‘Location’, and ‘Custodian’. In this step, we get to choose specific columns based on all 4 of these modules.
You can see the newly added columns highlighted in yellow in the image below:

We chose a few columns that would help us figure out which laptops had been transferred across different locations and between different custodians. This helps monitor the utilization of your hardware Assets and traces down which employees are responsible for them.
You can see that we chose two such columns for this purpose including ‘Custodian Email’ and ‘Asset Transfer History — To Location’. You can even add a Custom Field (‘Assets — Project Number’) to track the use of IT assets by individual projects. Intuitively, the Custom Fields relating to each category would appear at the very end of that category.
Step 3: Applying filters
For step 3 to appear, click the ‘Continue on creating filters’ link. You can now apply filters to your Custom Report by picking the relevant category, filling in the fields next to it, and clicking ‘Add Filter’. These filter options are also dependent on the primary and related modules you chose in Step 1.
We picked ‘Asset Transfer History’, ‘Custodian’, and ‘Location’, so we can add multiple filters based on any of these modules. Here’s an example:

We’ve chosen a Location filter for the Baltimore Office, as well as the filter that ensures the report only relates to Custodians in the ’Finance Department’ of the Baltimore Office. You can also choose between items displaying in an ascending or descending order, as shown below:

Note: You can’t run more than one of the same category of filter. For example, if the filter for Location is set to ‘Brooklyn Office’, you will not be able to create an additional one set for the ‘Scranton Office’.
Step 4: Sorting by Custom Fields
AssetSonar also allows you to sort your custom reports for items by custom fields, such as single texts, number fields and expiry dates. For example, in the following scenario, I want to sort the report by ‘Expiry Date’.

As this feature is applicable to items only, choose items while creating a report.

Choose the relevant option from the Available Columns.

Once you’re done selecting the modules, columns, and filters, you can go ahead and run the Custom Report you’ve just prepared for hardware Assets. You can see that the items are sorted by their expiry dates. Hit ‘Run Report’.

3. Creating custom reports for software licenses
Step 1: Selecting a module
When it comes to creating Custom Reports on software Assets or licenses, you can make reports that summarize when certain licenses are expiring and when they need renewal. In such a case, it makes more sense to pick the primary module labeled ‘Software Licenses’.

The related modules here will be Members and Assets.
Step 2: Selecting columns
When you select Software Licenses as the primary module, these are the corresponding columns that show up:

You can choose columns labeled ‘Expiring in’ and ‘Cost’ to identify how many licenses are expiring soon and how much would their estimated renewal cost be. You can also pick columns like ‘Members — Email’ or ‘Members — Last Name’ to identify which staff member is responsible for getting the license renewed.
Step 3: Applying filters
You can now select and apply filters relevant to each of the categories you’ve picked in Step 2.

If you want to filter for software licenses that are expiring within a month, you can set the filter equal to ‘This month’.
Once you’re done selecting the modules, columns, and filters, you can go ahead and run the Custom Report you’ve just prepared for software Assets. Hit ‘Run Report’.
4. Group line items
You can also group line items to make it easier for you to view and analyze the report. This feature clubs similar items together to improve report readability.
To begin, click on ‘Group rows’ under Step 3. Next, simply make your selections.

We’ll choose to group rows by Location names.
5. Use functions in reports
In step 5 of generating a custom report, you can apply functions to fields for greater insight.

You can choose any of the above functions to apply to the available numerical columns. You can apply a single function to a single field, for example, applying the Sum function on Items — Net Quantity, or you can apply multiple functions on the single field, for example, applying the Sum and Average functions on the field:

Similarly, you can also apply multiple functions to multiple fields as well.
5.1. Applying a single function
Let’s generate a simple report without applying any grouping yet. In this report, we’re applying the Sum function to the Cost Price field. On the last page of the report, you can see the Sum as highlighted below:

Note: The calculated amount for each function applied is not shown at the bottom of each page. Instead, it is shown at the bottom of the last page. In the case of grouping, it is shown at the bottom of each grouping.
5.2. Applying different functions on different fields
In this case, we are applying the Sum function on the Net Quantity field and the Max function on the Cost Price field. Here’s what the report will look like:

5.3. Applying functions on groups
You can also apply functions after you group rows in the report together in Step 4. In this example, we have grouped items together according to their group.

Then we have applied the Sum function on the Net Quantity field and generated the report. Here’s what the report looks like now, with the grouping:
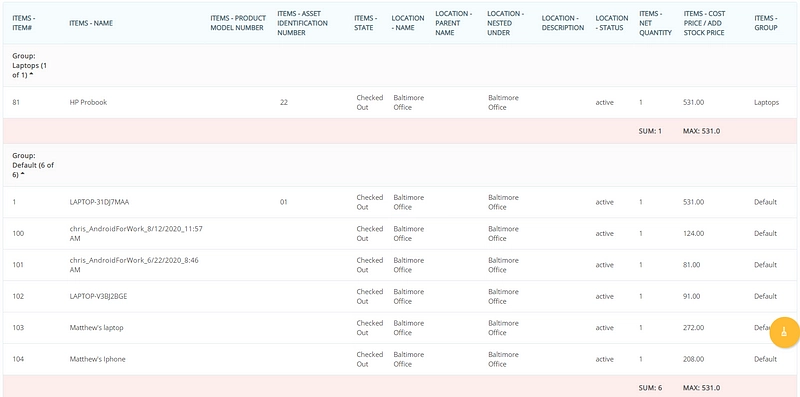
Instead of displaying the applied function on the last page of the report, it is now visible at the end of every group.
You can also collapse the rows to simply view the Sum of each group, without all the rows of data in between:

Similarly, you can also apply multiple functions to multiple groups as well.
6. Exporting Custom Reports
You can export your custom report by clicking on “Export”. You can export in CSV, PDF, and XLS formats.

If you are exporting the report in CSV or XLS format then you will be required to choose whether the report is “Formatted” or “Unformatted”.

Here’s how formatted and unformatted reports are different:
- Formatted: This displays all the information in the current view of the report including the groups.
- Unformatted: This displays all the information without any row/ column groupings i.e., allowing the user to export raw data that can be worked on later in the report. This makes the report editable on platforms like Excel and makes it easier to do further calculations if needed.
Note: The grouping columns will be added as columns at the end of the report.
7. Running your custom report
As you’ve seen, AssetSonar lets you completely customize your data reports. Step 1 allows you to choose primary and related modules, so you can have a report focus.
Step 2 then allows you to choose the specific columns that will make up your report. Step 3 helps you apply filters to your data pool, and Step 4 enables you to group columns for an even more precise report.
You can also click one of the following buttons based on your requirements:
- Run Report: To generate your new Custom Report.
- Save Report: To save the report template for future use (Please note the ‘Save Report’ button will only appear once you run the report).
- Schedule Report: To send this report to specific people at set intervals.
And with that, you’re done with the basics of Custom Reports in AssetSonar.
8. Scheduling Custom Reports
You can schedule custom reports to automate report generation and receive important updates at scheduled times. To schedule custom reports, go to Reports > Custom Reports Page → Relevant Custom Report → More → Schedule Report.
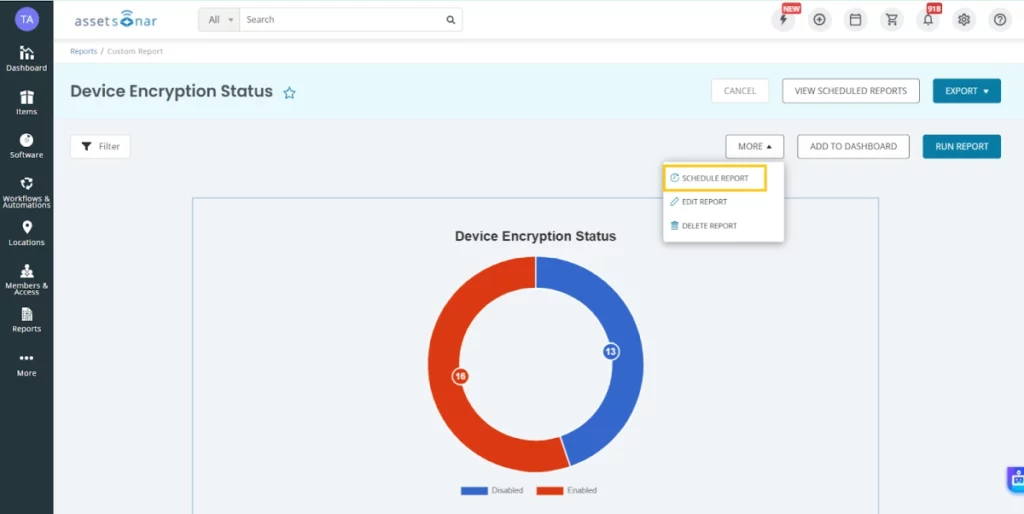
Start by providing a name for the scheduled report. For instance, if an IT manager wants to track asset availability each week, they can name the report ‘Weekly Asset Report’. You can then select the users who should receive this report via email.

Next, choose the report frequency – it can be daily, weekly, monthly, or yearly. In our case, we’ve set it to one week.

You may also provide starting and ending dates for the report. For example, the manager needs a weekly report for the first quarter. They can select 1st Jan as the starting and 31st Mar as the ending date. In addition, there’s an option to select a company-defined time or a different time to send out the report.
8.1. Viewing All Scheduled Reports
To improve collaboration and reduce scheduling confusion, AssetSonar allows all admins to view all scheduled reports across the organization—regardless of who created them.
A ‘View Scheduled Reports’ button is available on the main Reports listing page, in addition to the report detail page.
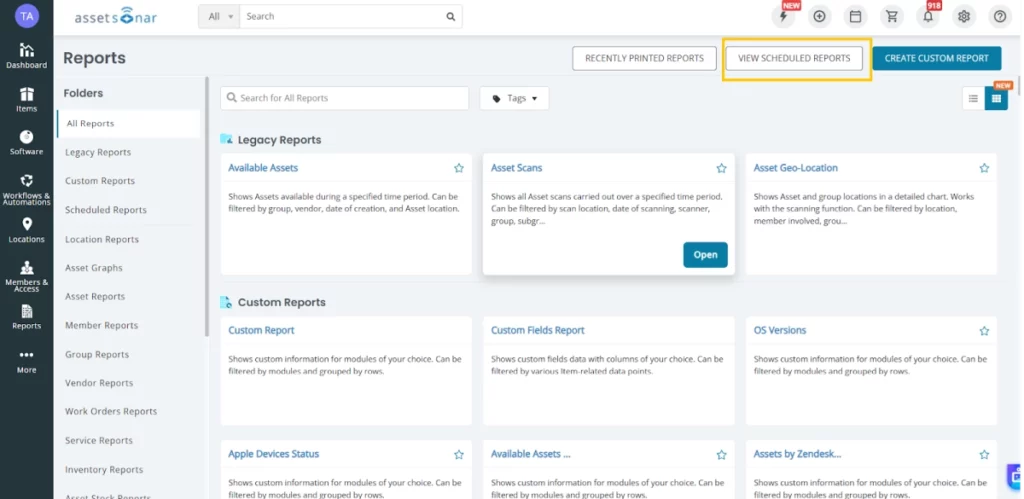
When you click on “View Scheduled Reports” it opens a popup that lists all scheduled reports, not just those created by the logged-in user.
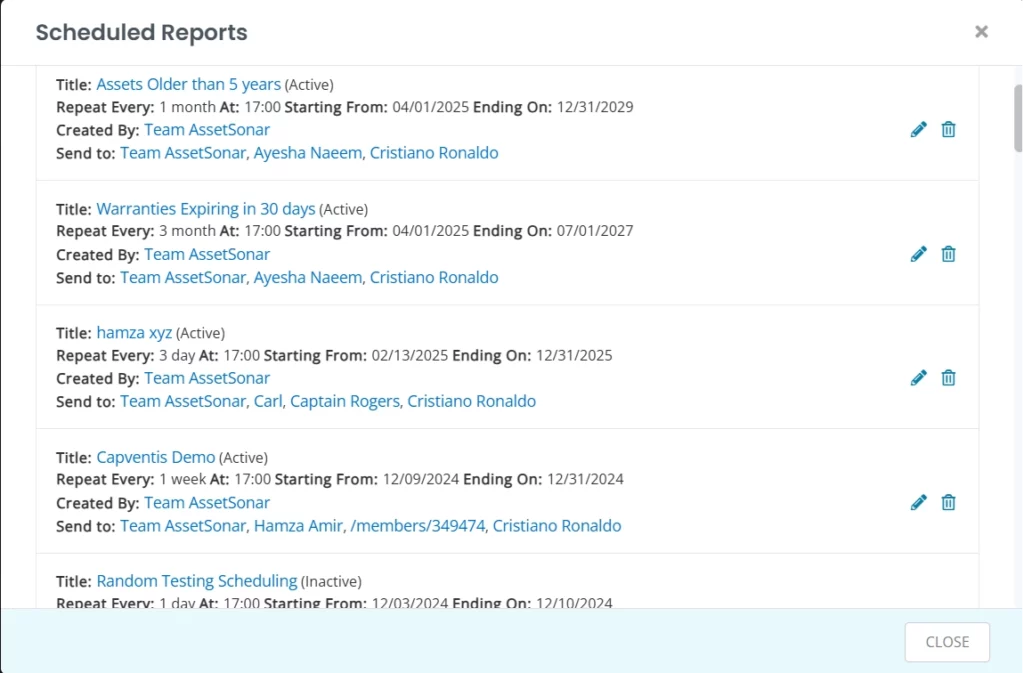
For each scheduled report, the following details are shown:
- Created by: The user who created the schedule (hyperlinked if viewable)
- Send to: List of recipients (also hyperlinked)
Admins can edit or delete scheduled reports if the original report was saved with ‘Share across All Admins’ enabled. If sharing isn’t enabled, they’ll still see the schedule but won’t be able to open or modify it.
Additionally, scheduling a custom report now no longer creates a separate copy of that report. Any changes made to the custom report will automatically reflect in the scheduled report. After the latest update, any existing custom and scheduled reports which are identical have been merged. However, if either version has changes, they will remain separate to avoid accidental data loss.
Moreover, now the option to edit a scheduled report has also been removed. Instead any changes made to the custom report will automatically reflect in the scheduled report.
Related FAQs
Can I use Custom Reports to determine the security compliance status of my IT devices?
Have Questions?
If you have any questions about AssetSonar, feel free to reach out to our support team at support@ezo.io.
