Managing server racks through spreadsheets or static diagrams can make it difficult to understand rack occupancy, locate available space, and visualize the physical arrangement of infrastructure.
AssetSonar’s Server Rack Visualization provides a canvas-based workspace where IT teams can digitally recreate their physical server racks and place components into their corresponding U-positions. You can create and maintain multiple rack diagrams from within AssetSonar instead of relying on separate documentation.
1. Enable Server Rack Visualization
To enable the feature, go to:
Settings → Company Settings & Add-ons → Server Rack Visualization
Select Enable and save your changes.
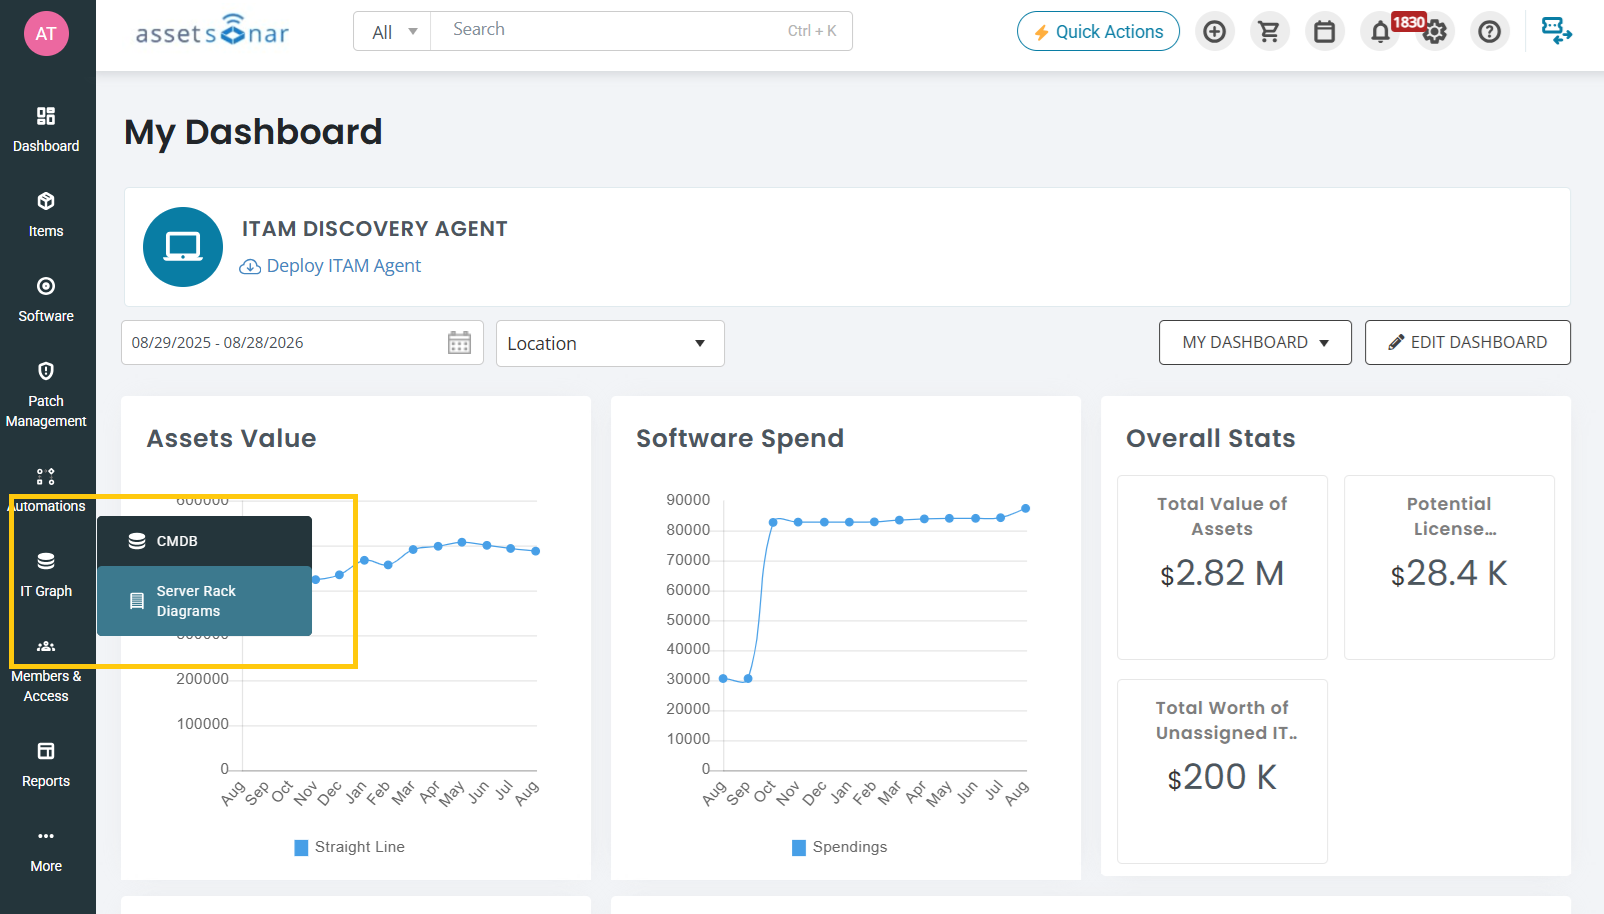
Once enabled, you can access Server Rack Visualization from the navigation menu.
- If IT Graph is enabled, Server Rack Visualization appears as a sub-module under IT Graph.
- If IT Graph is not enabled, Server Rack Visualization appears independently under More.
2. Create a Server Rack Diagram
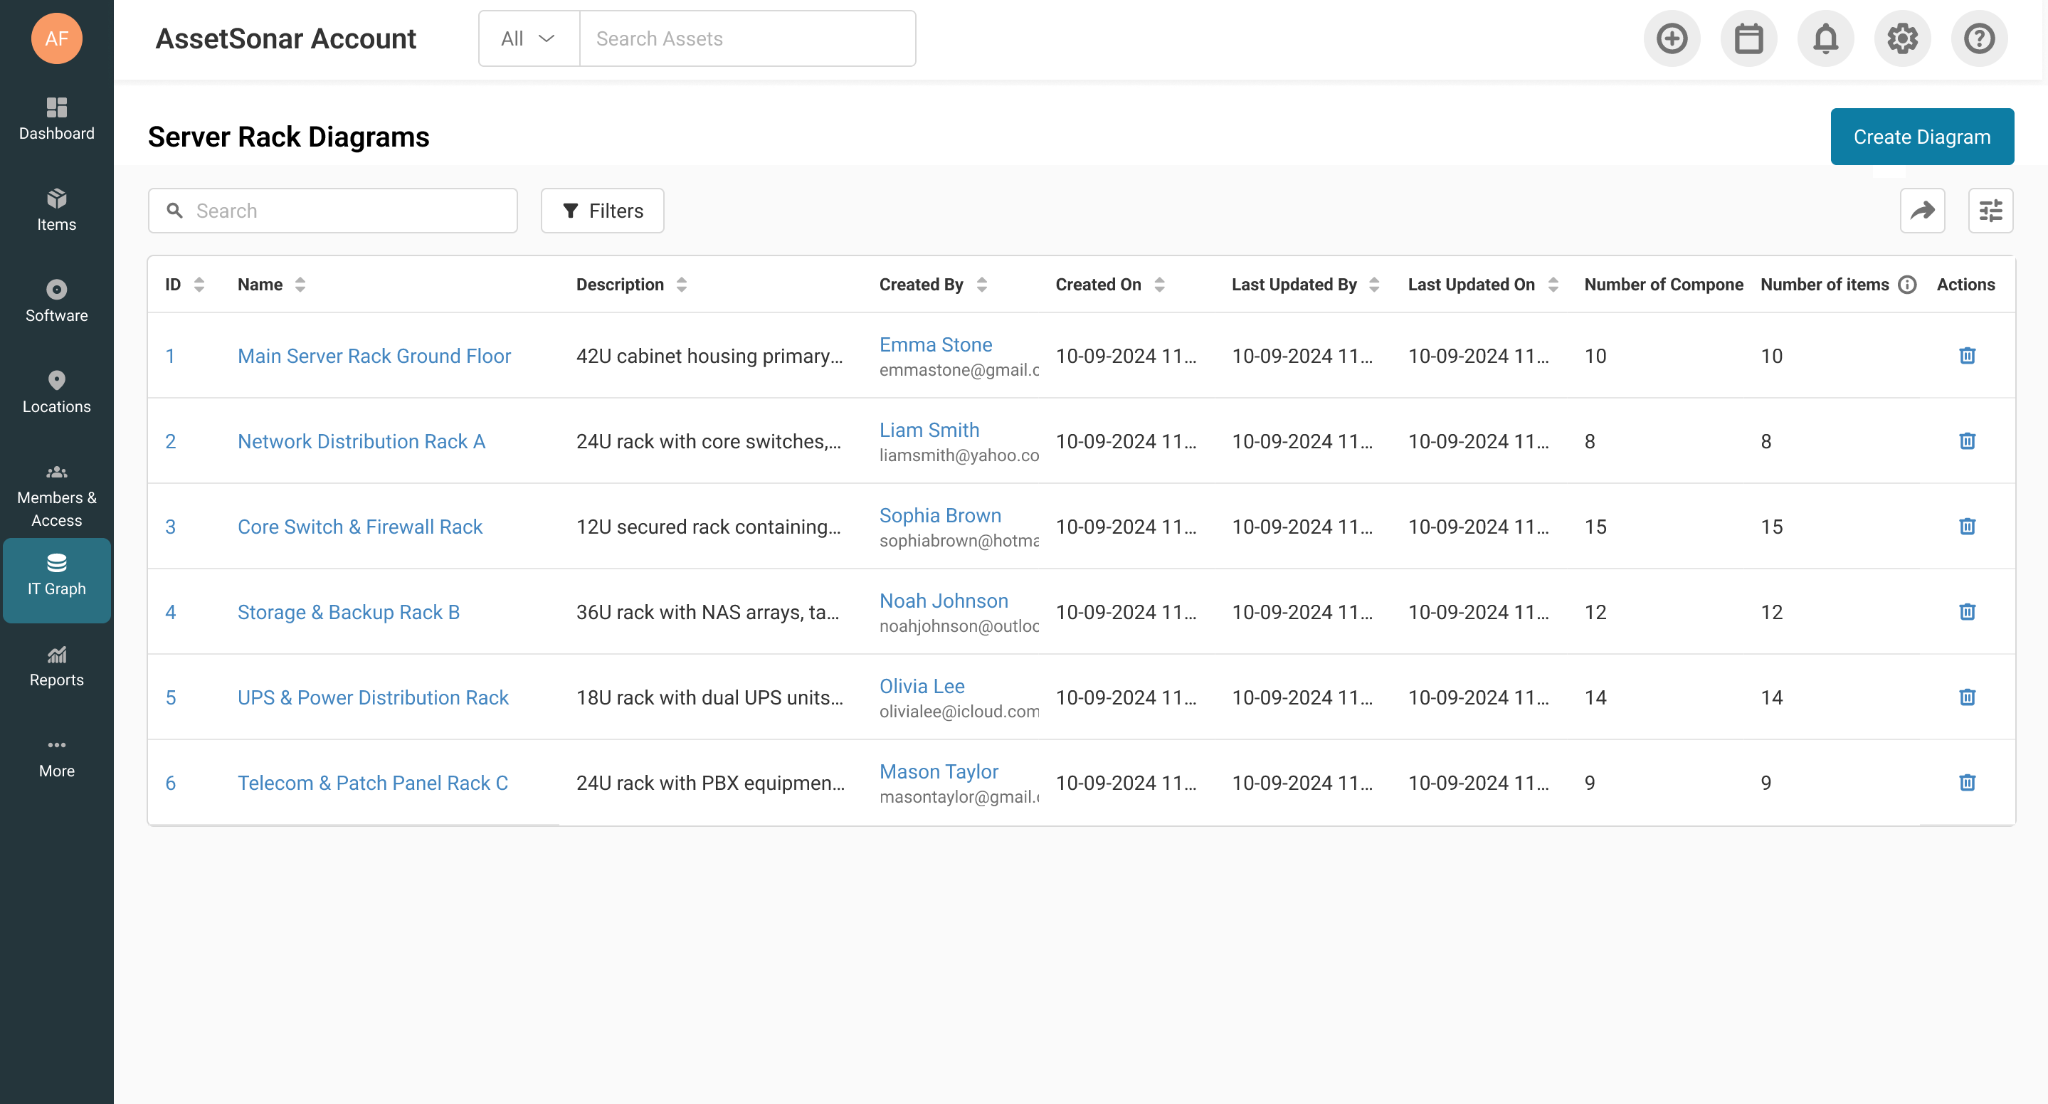
Open Server Rack Visualization to access the diagram listing page.
Click Create Diagram to create a new server rack diagram.
Enter the diagram name and description so that the rack can be easily identified later.
For example, you may create separate diagrams for individual server rooms, data centers, floors, or racks.
The diagram opens in a canvas where you can visually recreate the physical server rack.
Use the available component icons to add infrastructure components to the diagram and position them within the required U-slots.
Available rack components can include equipment such as:
- Empty plates
- Network switches
- KVMs
- Servers
- RAID/NVMe storage
- Network-attached storage
- UPS units
The rack visualization lets you position these components according to their physical placement so that the diagram represents the actual rack layout.
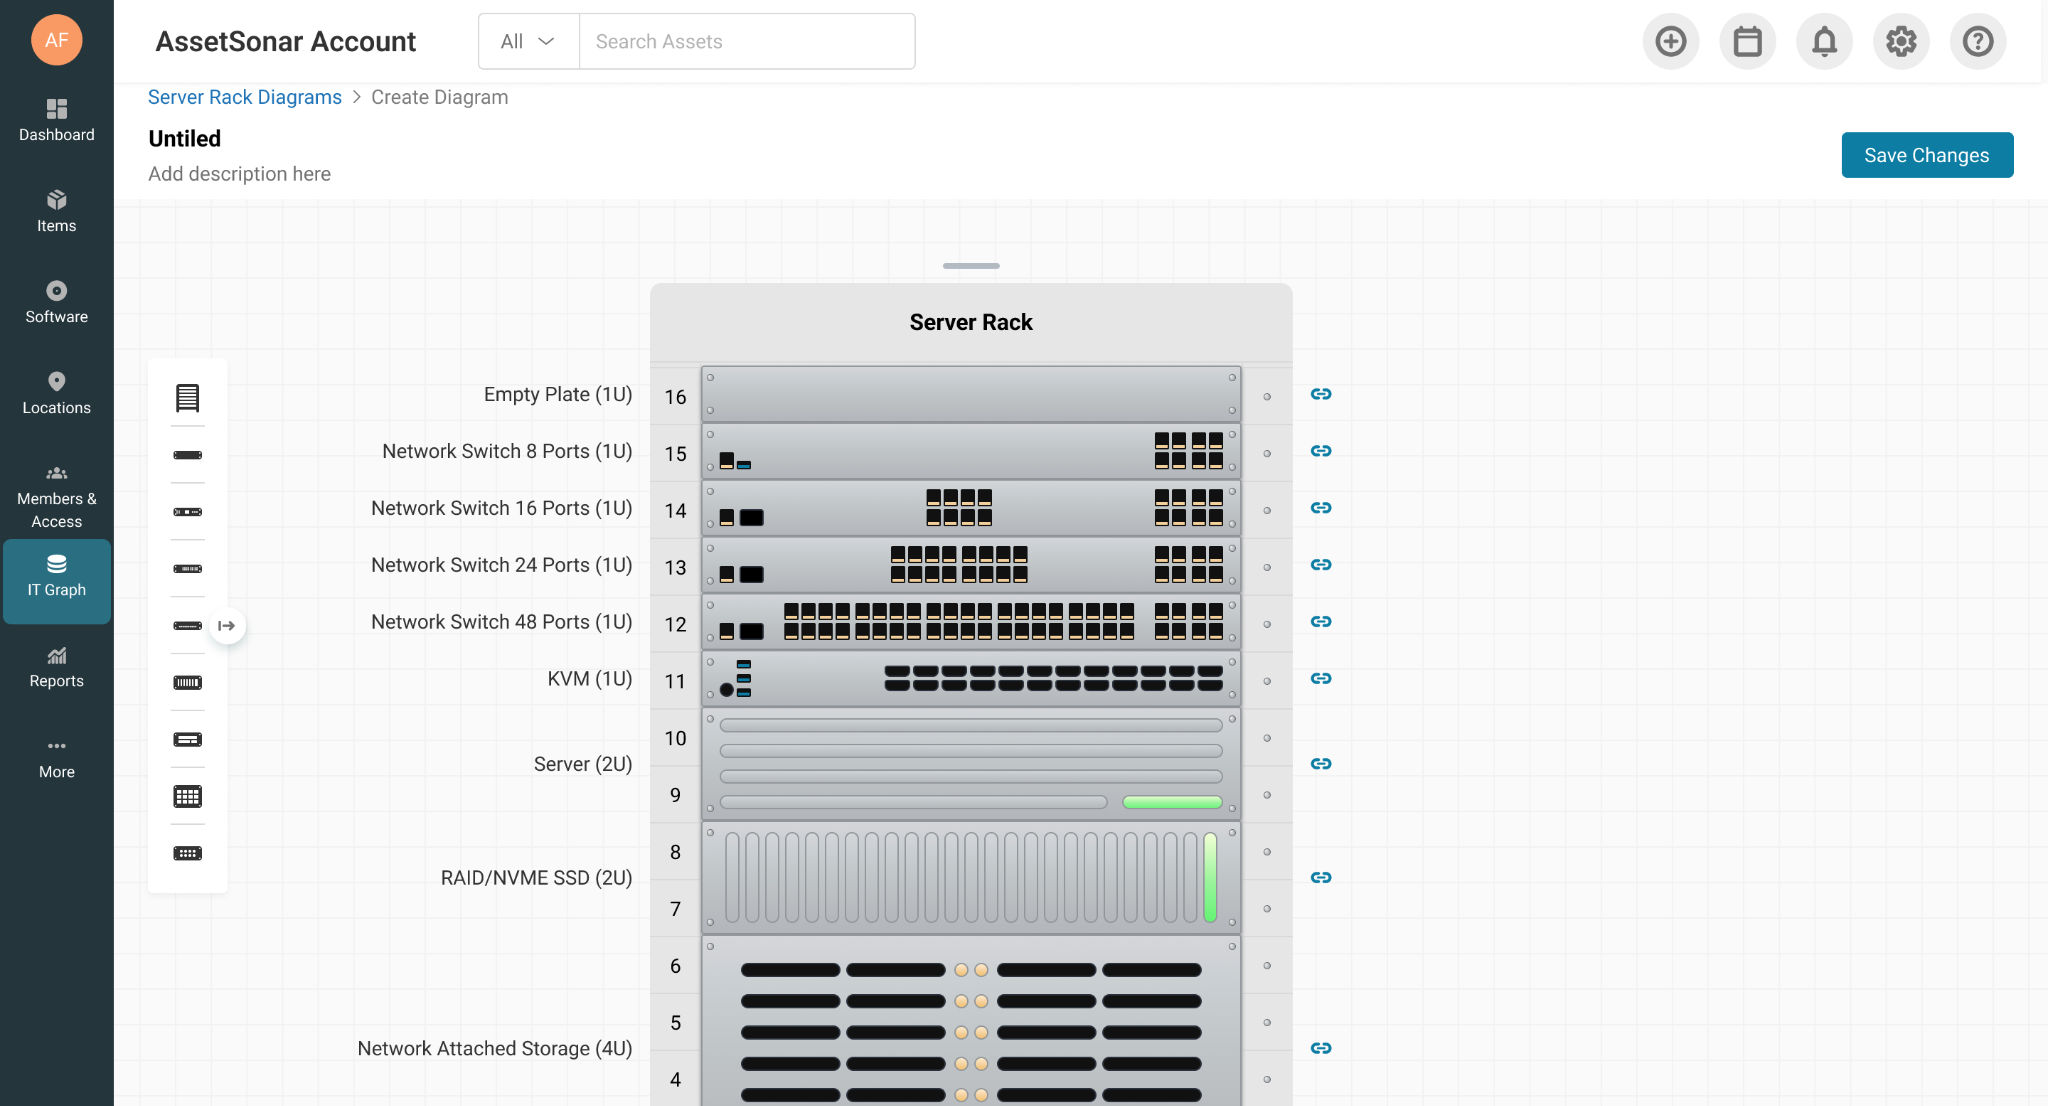
You can move components on the canvas as required while building or updating the rack layout.
3. Update Component Details
Click a component on the canvas to open its configuration options.
Use these settings to update the information associated with the component as required.
This allows the same rack diagram to be updated when equipment is moved, replaced, or reorganized.
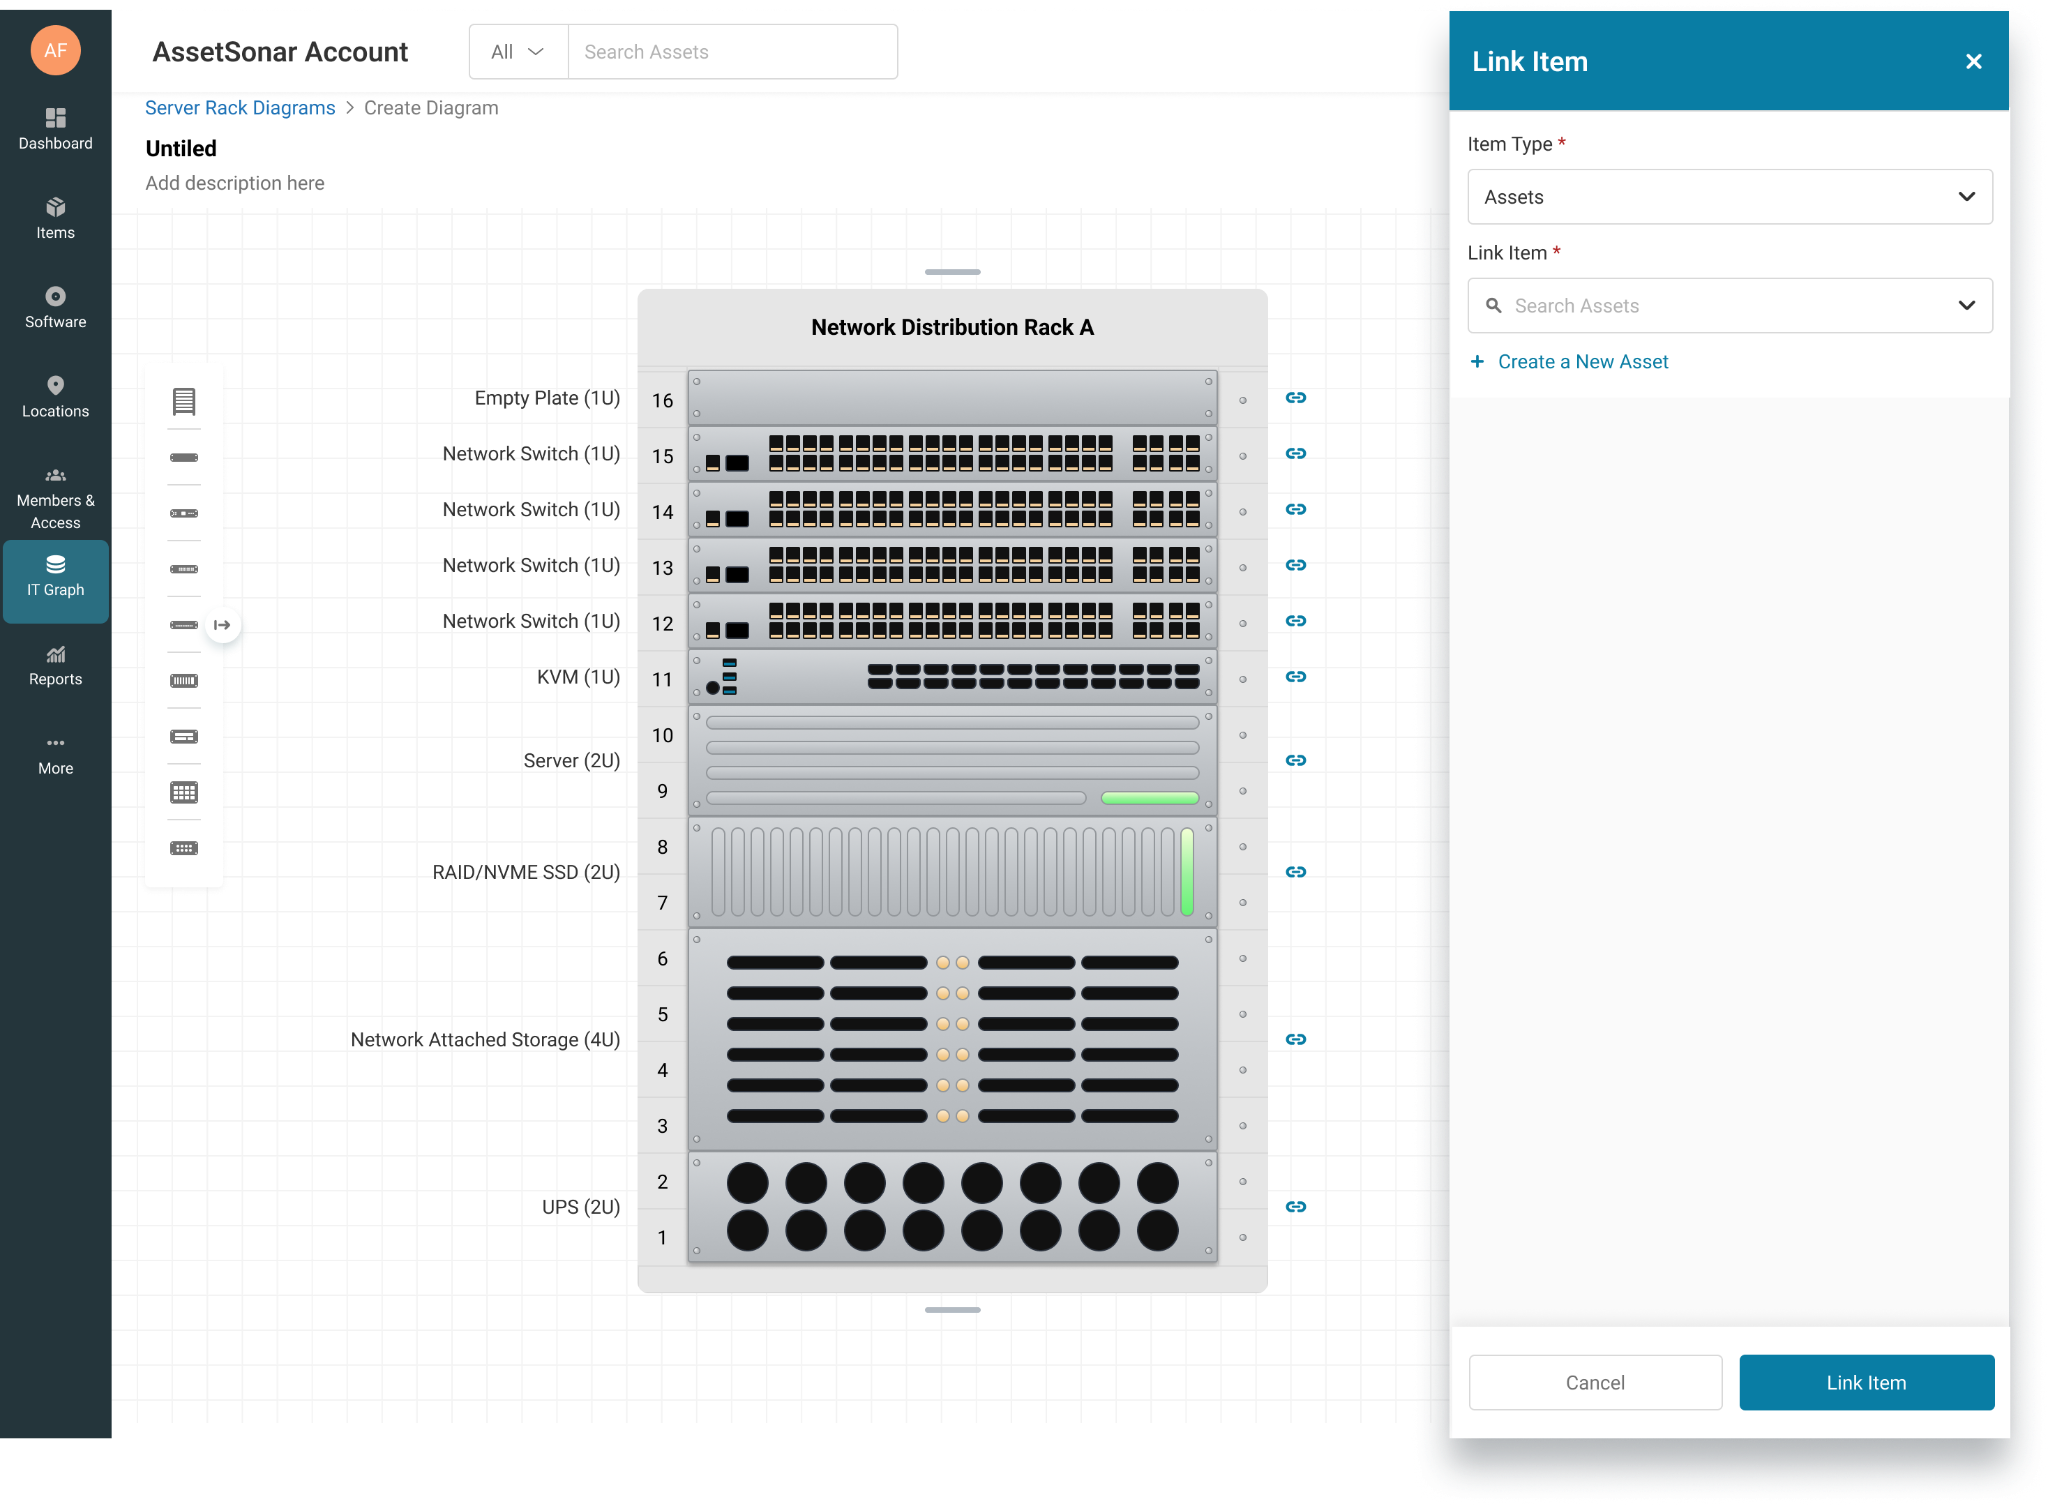
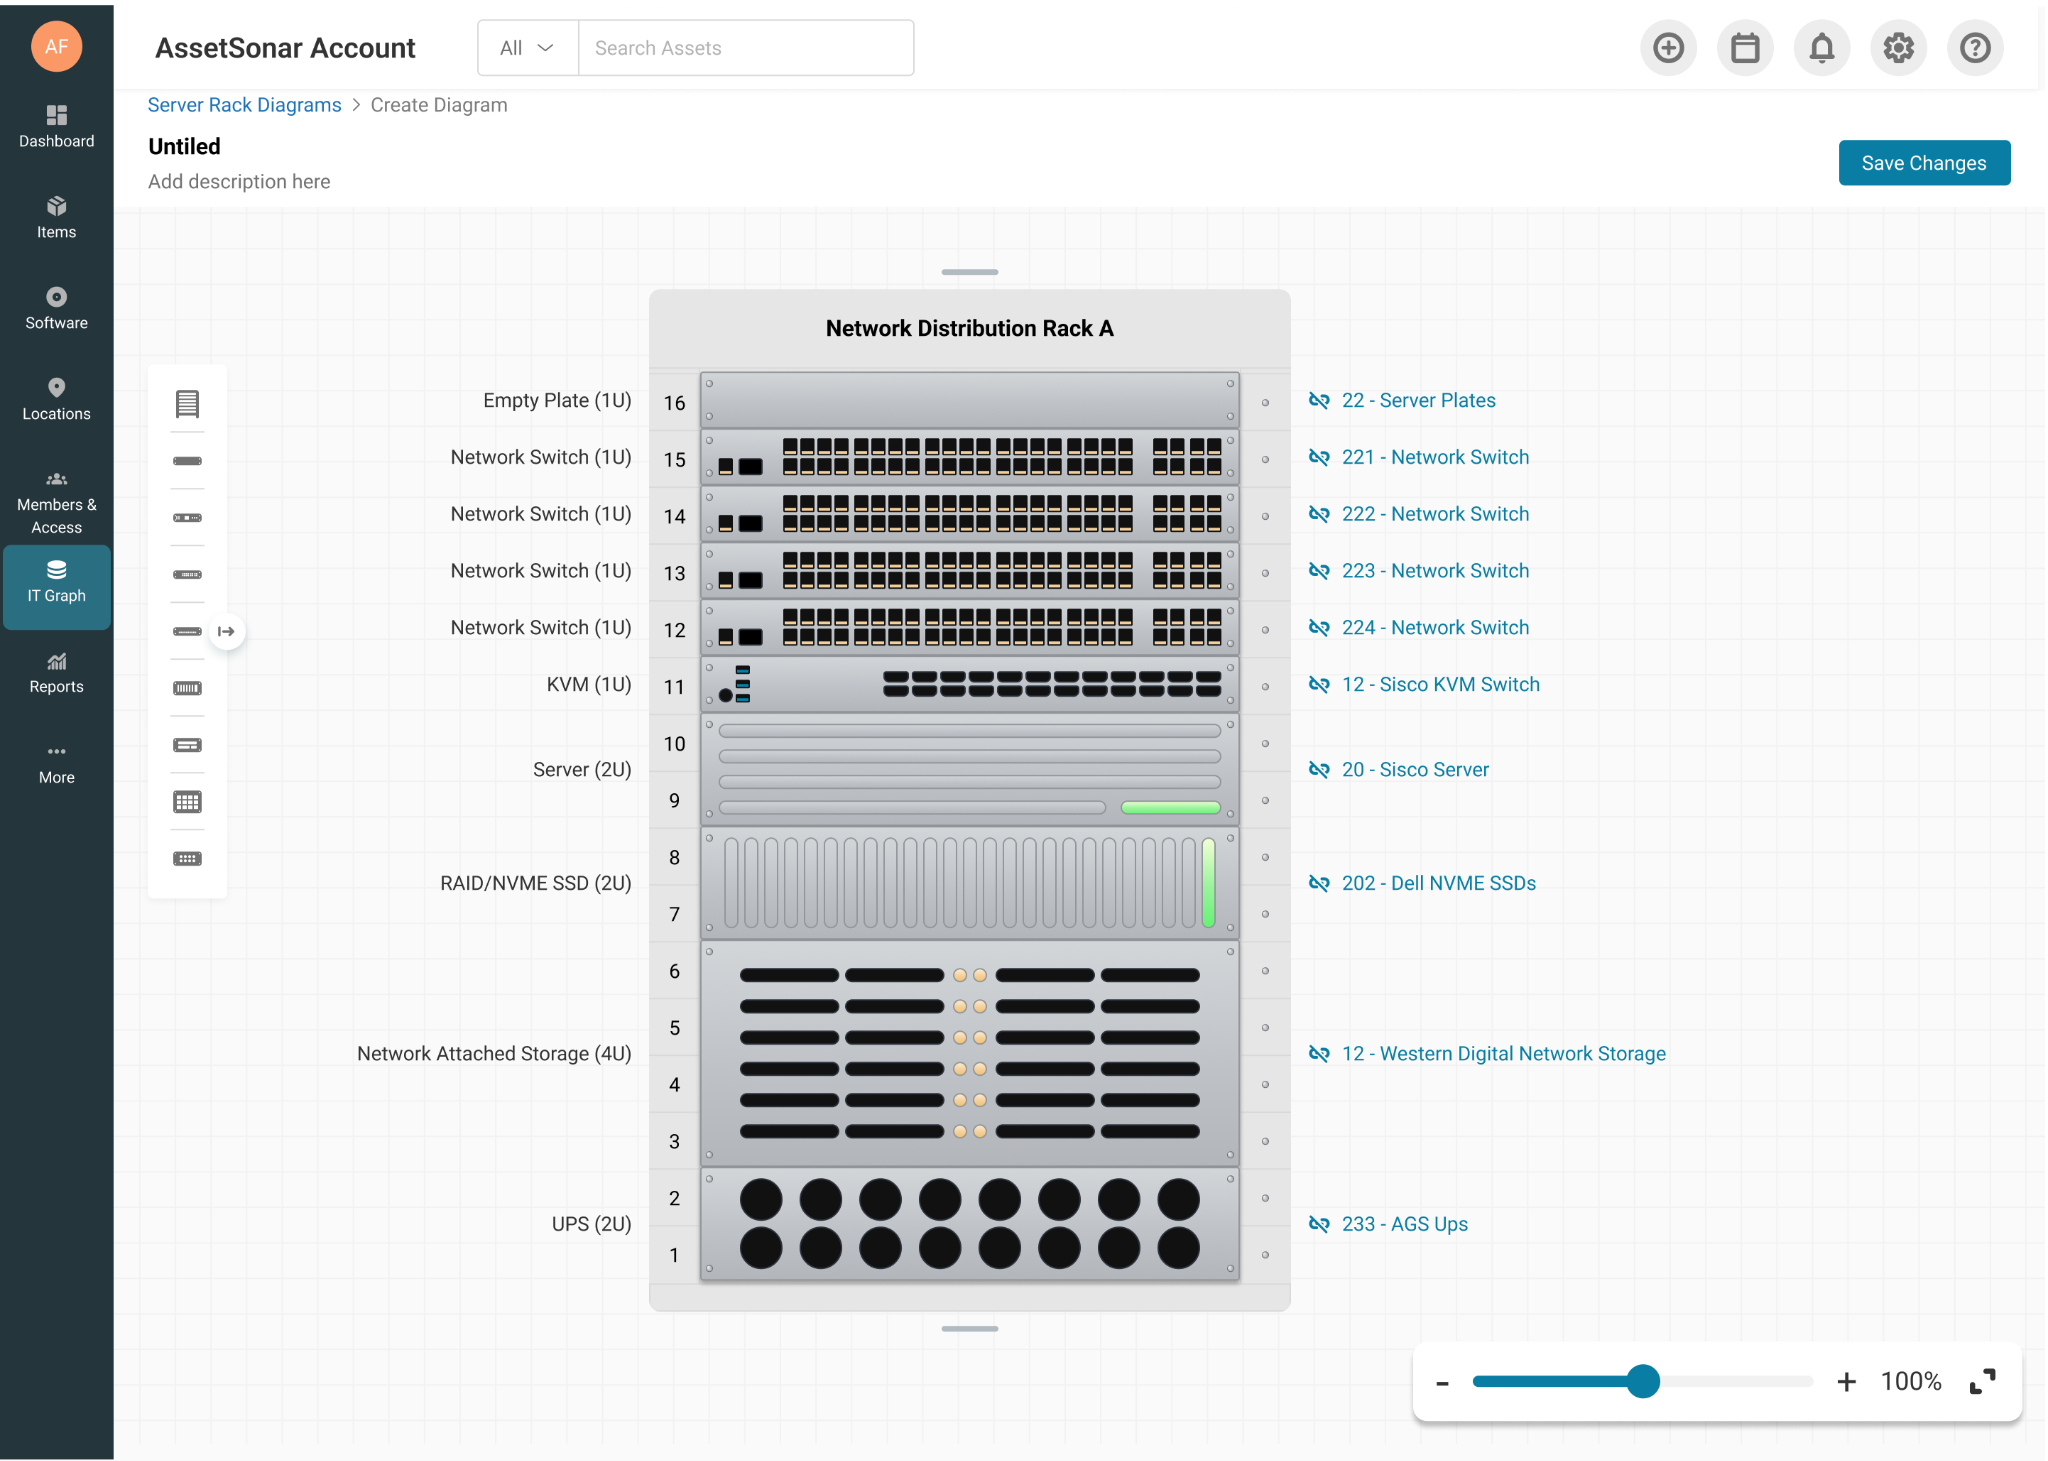
After making changes to the rack, click Save Changes.
4. Manage Server Rack Diagrams
Return to the Server Rack Visualization listing page to view and manage your existing diagrams.
You can also search for diagrams using their name or ID.
Filter Server Rack Diagrams
Use filters to narrow the listing based on:
- Created By
- Last Updated By
- Created On
- Last Updated On
This can be useful when maintaining a larger number of rack diagrams across different environments or teams.
Visualize Your Physical Infrastructure in AssetSonar
Server Rack Visualization gives infrastructure teams a visual representation of their physical rack layouts directly inside AssetSonar. By maintaining rack diagrams according to actual U-position occupancy, teams can more easily understand existing rack configurations and keep physical infrastructure documentation centralized alongside their IT asset data.
