Disclosure: EZO develops EZO EAM, one of the platforms evaluated in this guide. We assessed every product against the same criteria, using the same profile template and evidence standard, and distinguished among native capabilities, separately licensed modules, integrations, plan-gated features, and capabilities we could not verify publicly. This disclosure appears before EZO EAM receives any recommendation or ranking.
Enterprise asset management (EAM) executive reporting brings financial, operational, and reliability data together so leaders can evaluate what an asset costs, how reliably it operates, and whether it should be maintained, replaced, transferred, or retired. The best platform is the one that answers all three questions using records a user can trace back to source, not the one with the longest feature list.
Key takeaways
Executive EAM reporting should connect financial value, operating performance, and future risk to traceable source records.
- Operational and statutory depreciation are different capabilities, and financial ownership often remains with the ERP.
- Asset health scores describe current condition, while predictive maintenance estimates future failure or maintenance requirements.
- Displaying physical audit results beside financial records is not reconciliation without matching rules, exception handling, and ownership.
- EAM comparisons should distinguish native, module-based, integrated, limited, and unverified capabilities rather than rely on feature counts alone.
- Vendor demos should test KPI definitions, drill-down traceability, and reporting capabilities using the buyer’s own asset data.
- Reporting costs extend beyond licensing to include integrations, data governance, administration, and ongoing reconciliation work.
The best EAM reporting platforms at a glance
| Platform | Best for | Depreciation schedule | Downtime reporting | Asset health | Pricing visibility |
|---|---|---|---|---|---|
| EZO EAM | Accessible multi-site asset reporting | Native [1] | Native [2] | Limited [3] | Published [4] |
| IBM Maximo Application Suite | Complex industrial asset estates | Native [5] | Native | Module [6] | Published starting price [7] |
| SAP S/4HANA Asset Management | SAP-centered enterprises | Not publicly verified [8] | Native | Module [9] | Quote |
| IFS Cloud EAM | Service and asset-intensive enterprises | Not publicly verified | Native | Integration [10] | Quote |
| Oracle Fusion Cloud Maintenance | Oracle-centered finance environments | Not publicly verified | Native | Integration [11] | Quote |
| Octave Attune EAM | Reliability-led industrial operations | Not publicly verified | Native | Module [12] | Quote |
| IFS Ultimo | Configurable enterprise maintenance reporting | Not publicly verified | Native [13] | Limited | Quote |
| Aptean EAM | Manufacturing maintenance teams | Not publicly verified [14] | Native | Limited | Quote |
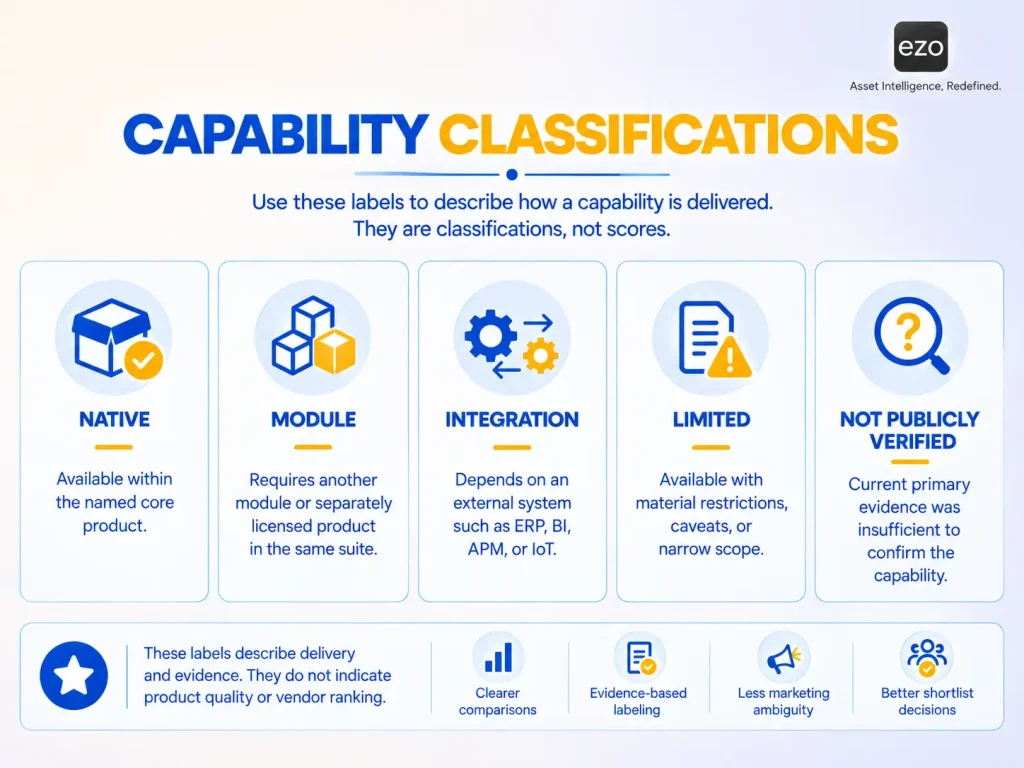
How to read the labels. Every capability cell in this article uses exactly one of five classifications:
- Native means the capability sits in the named core product with no separately licensed component and no external system.
- Module means another component of the same suite or a separately packaged add-on is required.
- Integration means it depends on an external system.
- Limited means it exists with material restrictions.
- Not publicly verified means we could not source it from current primary evidence, which is not the same as saying it is absent.
Where a cell carries a footnote, the footnote identifies a material dependency or configuration requirement.
Source note: Capabilities, packaging, and pricing were checked against first-party vendor documentation and pricing pages on September 9, 2026. Footnotes for all tables in this article are numbered in a single continuous sequence and appear beneath the commercial comparison.
Introduction
For 2026, the eight platforms worth evaluating are EZO EAM, IBM Maximo Application Suite, SAP S/4HANA Asset Management, IFS Cloud EAM, Oracle Fusion Cloud Maintenance, Octave Attune EAM, IFS Ultimo, and Aptean EAM. EZO EAM suits organizations that need accessible asset lifecycle and multi-site reporting. IBM Maximo is built for complex industrial estates. SAP and Oracle are strongest where the enterprise resource planning (ERP) system already governs financial data. IFS Cloud EAM fits asset-intensive and service environments. Octave Attune EAM suits reliability-led operations, while IFS Ultimo and Aptean EAM are more maintenance-oriented alternatives.
Five things to establish before comparing anything else:
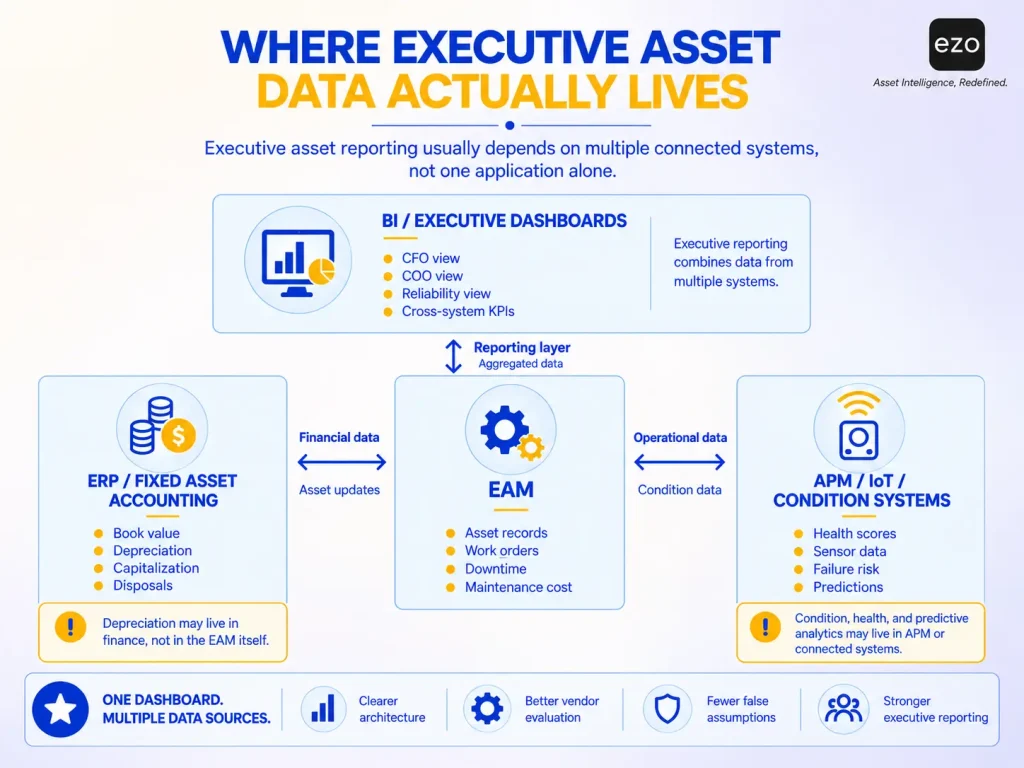
- Depreciation means three different things. A platform may calculate an operational depreciation schedule, display values imported from an ERP, or simply be connectable to a system that calculates them. A feature-matrix checkmark rarely tells you which one applies.
- Depreciation is not always an EAM native capability. In SAP, it sits in Asset Accounting. In Oracle, it sits in Fixed Assets. Buyers should distinguish EAM reporting from the financial system that owns the statutory depreciation calculation.
- An asset health score is not predictive maintenance. A condition indicator summarizes the present. A prediction estimates the future.
- Displaying a fixed asset register next to a physical audit is not reconciliation. Reconciliation requires matching rules, exception handling, and an owner.
- Feature count is not decision quality. What matters is where each number comes from, how trustworthy it is, and how many steps separate the insight from the decision.
What executive EAM reporting has to bring together
Finance teams need acquisition cost, depreciation, book value, and disposal data, as well as confidence that the register still matches what physically exists. Operations teams need downtime, availability, maintenance cost, and production impact. Maintenance and reliability leaders need asset health, failure risk, mean time between failures (MTBF), mean time to repair (MTTR), and backlog. Those figures usually originate in different systems. A platform may calculate a given metric natively, obtain it through an ERP or asset performance management (APM) integration, gate it behind a plan tier, or require a custom report. This guide separates those delivery models for eight platforms.
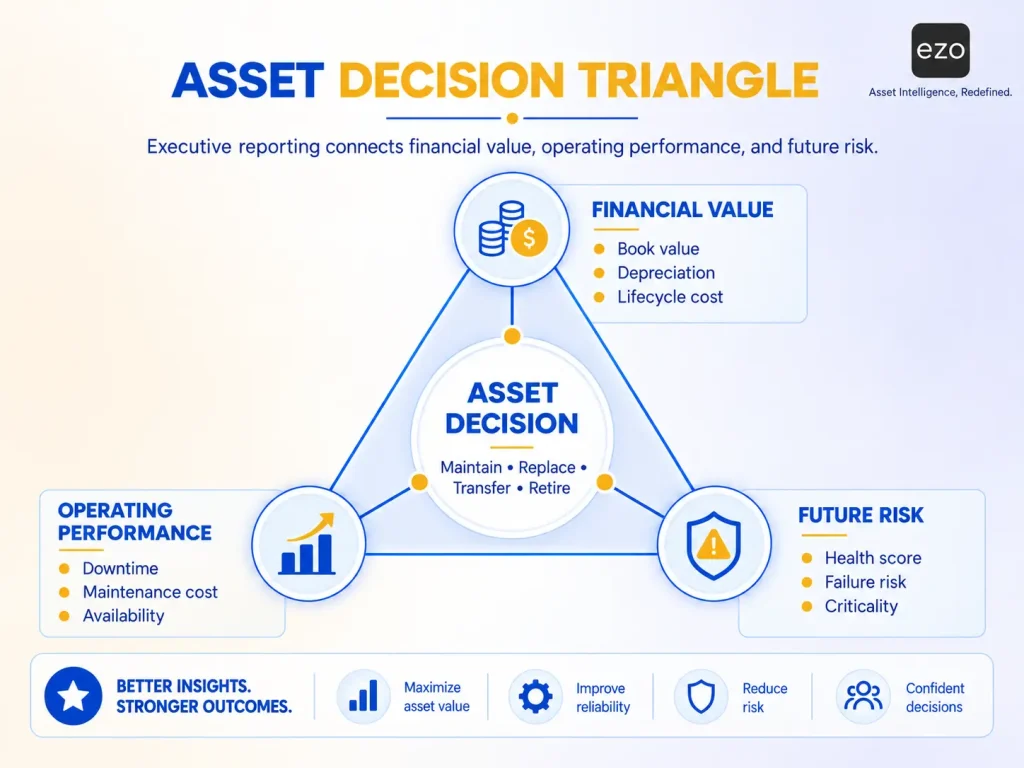
Underneath the comparison sits a simpler point. Executives rarely look at an asset because they want more information. They look at it because the asset represents a decision, and every one of those decisions turns on three connected questions: What is this asset worth? How is it performing? And what happens if we do nothing?
These three questions form the evaluation framework for this guide, which we call the Asset Decision Triangle. It is not an industry standard, and it has three dimensions:
- Financial value: what the organization has invested and what the asset is worth now.
- Operating performance: what the asset is actually doing for the organization.
- Future risk: what happens if the organization keeps operating it as it is?
Financial value without operational performance leads to decisions that look neat on paper but perform poorly on the plant floor. Operating performance without future risk encourages short-term optimization. Future risk without financial value produces recommendations that are harder to fund or prioritize. A useful EAM reporting environment holds all three together and lets a user trace each one back to a source record.
How we selected, ordered, and labeled the platforms
What qualified a platform for inclusion
- Enterprise asset management scope. The platform must manage the asset lifecycle beyond work order execution, including asset records, cost, location, and retirement.
- Documented executive reporting. Dashboards or reporting must span more than one of financial value, operating performance, and asset risk.
- Current availability under the current product name as of September 2026.
- Public documentation is sufficient to classify at least two of the three reporting domains without relying on vendor marketing claims.
What we excluded, and why
Maintenance-first platforms, including MaintainX, UpKeep, Limble, Fiix, and eMaint, were excluded under criterion 1: they are strong computerized maintenance management systems (CMMS), but their documented lifecycle and financial reporting scope falls outside enterprise asset management. Our separate guide to maintenance management software covers that category, and our CMMS versus EAM comparison sets out the boundary. Fixed-asset accounting tools and ERP fixed-asset modules were excluded because they are financial systems rather than EAM platforms, although several of them appear in this article as the systems of record on which EAM platforms depend.
What we evaluated
- Executive dashboard coverage: Role-based views, multi-site consolidation, scheduled reporting, and drill-down to source records.
- Depreciation and financial reporting: Acquisition cost, useful life, salvage value, accumulated depreciation, net book value, and disposal.
- Downtime and reliability: Planned versus unplanned downtime, duration, cost, MTBF, MTTR, availability, overall equipment effectiveness (OEE), and reason codes.
- Asset health: Condition indicators, scores, inspection and meter inputs, criticality, and predictive functionality.
- Data and integrations: ERP, accounting, manufacturing execution systems (MES), supervisory control and data acquisition (SCADA), Internet of Things (IoT) sources, business intelligence (BI) tools, and application programming interfaces (APIs).
- Commercial and operational fit: pricing visibility, plan gating, trial access, and implementation requirements.
- Evidence quality: Primary documentation is weighted over marketing language.
What the ordering does and does not mean
The order reflects the fit for this article’s specific use case, cross-functional executive reporting, and favors what we call accessible reporting. That term is defined here by four observable tests:
- published rather than quote-only pricing
- self-serve trial access
- core reporting without a separately licensed analytics component
- single product rather than multi-component scope..
This is not a general quality ranking, nor is it derived from a numerical score. This guide evaluates documented capability fit for executive reporting. It does not assess usability, implementation difficulty, support quality, or realized customer outcomes, none of which can be established from vendor documentation. A platform lower in this list may be the better choice for a different problem, and several of them are.
1. EZO EAM: best for accessible multi-site asset reporting
Best fit. EZO EAM suits multi-site operations that need reporting on assets, locations, costs, custody, utilization, and maintenance without requiring an enterprise transformation program. It is delivered as a cloud product, with offline mobile and dispatch capabilities available at the enterprise tier.
Executive reporting. EZO supports standard and custom reports covering asset counts, depreciation, checkout activity, maintenance cost, utilization, availability, transfers, overdue and retired assets, and salvage value, with filters, visualizations, and scheduled distribution. Plan gating matters. We apply the same scrutiny here as elsewhere: standard reports appear on all published plans; advanced and custom reports, purchase orders, audits, and API access begin at Advanced; request workflows and utilization insights begin at Premium; and telematics is available at Enterprise.
Depreciation and financial reporting. Depreciation is included in every published plan. EZO supports straight-line and declining-balance models configured at the group level. The system calculates depreciation monthly, includes a salvage value field, and allows both models to run simultaneously. See EZO’s guides to asset depreciation and to keeping a schedule accurate as assets transfer or retire. EZO EAM is not a financial system of record: tax books, depreciation areas, impairment, and statutory reporting stay with the ERP.
Downtime and reliability. EZO documents downtime and asset diagnostics reporting alongside maintenance costs, bridging cost and operational performance. EZO’s preventive maintenance materials describe how to track MTTR and MTBF on maintenance dashboards. Because these metrics are available through CMMS capabilities packaged at Premium and included with Enterprise, this article labels them “Module” rather than “Native.”
Asset health. Condition, inspection, and service history support lifecycle decisions. There is no published probabilistic health model or remaining-useful-life calculation, so buyers wanting APM-style analytics should look elsewhere or plan an integration.
Integrations, data access, and security. API access and webhooks begin at the Advanced tier, while the named integrations sit higher: QuickBooks Online, LDAP and SAML, Zendesk, and Jira are available starting at Premium. See EZO’s integrations page and developer documentation. EZO documents its security posture, including ISO 27001 and GDPR, on its security page.
Pricing and packaging. Pricing is item-based rather than per-user. At the 300-item level in September 2026, monthly pricing was $63.55 for Essential, $85.51 for Advanced, and $100.88 for Premium, with Enterprise quoted individually. Published plans include unlimited users under a fair-use policy; CMMS is priced separately per admin user; and each plan offers a 15-day free trial with no credit card required. Confirm current pricing and the required tier at purchase.
Primary limitation. Statutory accounting and predictive analytics require another system, and reliability metrics require CMMS packaging rather than the base plans. Broader asset visibility also introduces governance work: statuses, ownership, and lifecycle policies need to be defined before rollout, or the dashboard will surface inconsistencies faster.
Verdict. EZO EAM covers asset, location, cost, utilization, and maintenance reporting in one accessible view, with published pricing and a self-serve trial. It does not cover statutory accounting or predictive analytics. This trade-off works for organizations whose reporting problem is turning existing asset data into management information, but works poorly for organizations that need one system to own both the register and the general ledger.
2. IBM Maximo Application Suite: best for complex industrial asset estates
Best fit. IBM Maximo Application Suite suits large asset-intensive organizations with complex hierarchies, mature reliability practices, and the resources to support a multi-component suite implementation. It is available as a cloud, on-premises, or hybrid deployment.
Executive reporting. Maximo provides customizable dashboards and reporting across asset health, work order trends, maintenance history, costs, and compliance. Maximo Health adds configurable asset and location dashboards, and Maximo Monitor adds historical trend visualization, drill-down, anomaly detection, and alerts.
Depreciation and financial reporting. Maximo has a documented operational depreciation capability, which is worth stating plainly because some comparisons describe Maximo as having none. IBM documents adding depreciation schedules to assets, where date-based schedules depreciate value at set time intervals and usage-based schedules depreciate against an asset meter, using straight-line or double-declining methods with a salvage amount. Transactions are generated for transfer to a finance system, so statutory accounting still resides in the ERP. This is the same class of capability that EZO provides, and it is classified the same way here.
Downtime and reliability. Reliability is Maximo’s strongest area, and it provides the clearest example in this article of why metric definitions matter. IBM’s Maximo Health documentation states that MTBF is calculated by dividing asset age since installation by the number of unscheduled work orders in that period, and that an asset must carry an installation date for the score to be calculated at all. IBM’s Maximo Health 9.0 release note describes the same score as total operating time divided by failures. Both are IBM sources, and they do not say the same thing. Therefore, organizations should verify which formulation their specific release implements before benchmarking against it.
Asset health. Health scores can incorporate condition measurements, meters, events, and derived values, with weights assigned to each contributing to the final score. The documentation also describes default health, criticality, and risk scores, as well as remaining useful life capabilities. The architectural caveat is that these capabilities sit in Maximo Health, Monitor, and Predict rather than Maximo Manage, so “Maximo supports it” is an incomplete answer. Ask which component and what it costs.
Integrations, data access, and security. Maximo provides broad enterprise and industrial IoT connectivity, with support for external analytics and enterprise identity and audit controls..
Pricing and packaging. IBM publishes indicative SaaS starting prices. Maintenance starts at US$40,000 per year for one environment and up to 25 users, using a credit-based AppPoints model. Larger and client-managed deployments remain quote- and usage-dependent.
Primary limitation. Capability spread across components creates real cost and implementation complexity, and the reliability reporting most buyers associate with Maximo is not in the base product.
Verdict. Maximo is the right answer when asset complexity itself is the problem. This is because hierarchy, permissions, standardized metric definitions, and drill-down capabilities become critical as asset estates grow. The trade-off is that health, monitoring, and prediction are priced separately; therefore, a budget built on Manage alone understates total reporting costs.
3. SAP S/4HANA Asset Management: best for SAP-centered enterprises
Best fit. SAP S/4HANA Asset Management suits enterprises where SAP is already the financial and operational backbone. It is deployed in the cloud or on-premises within the SAP landscape.
Executive reporting. SAP provides maintenance and technical asset management with embedded analytics. Its practical advantage is that technical asset data sits in the same environment as the broader SAP data architecture.
Depreciation and financial reporting. This is where SAP requires precision. SAP documents this module as a subsidiary ledger to the general ledger. It provides detailed data on transactions such as acquisitions, depreciation, and retirements, and supports depreciation areas, methods, useful lives, and net book values. One detail worth surfacing in a demo is that SAP documents how maintenance activities requiring capitalization can be settled from Plant Maintenance directly to Asset Accounting. This connection is what buyers typically need when they request depreciation in an EAM dashboard. It is a configuration process rather than a report to switch on. We found no documentation of a separate operational depreciation schedule inside the maintenance product itself.
Downtime and reliability. SAP provides native maintenance and technical-object reporting, including measurement points, hierarchies, utilization, and maintenance planning. Configuration determines how planned and unplanned downtime is categorized and which reliability metrics are available.
Asset health. Condition monitoring and more advanced performance use cases require additional SAP capabilities beyond the maintenance product alone.
Integrations, data access, and security. SAP offers one of the tighter couplings of maintenance and governed financial data in this comparison, provided the organization is already inside the ecosystem. Enterprise-grade identity, audit, and controls are inherited from the wider platform.
Pricing and packaging. Pricing is quote-based. Implementation effort rises with scope, integration complexity, and the number of SAP components involved.
Primary limitation. Capability is distributed across SAP products, so the reporting picture depends on which components are licensed.
Verdict. SAP is the strongest fit here for connecting technical asset data to governed financial data, but only for organizations already inside the ecosystem. The key question is how much asset decision-making currently breaks at the boundary between maintenance and finance. That is the gap SAP is designed to close, and it is what you are paying for.
4. IFS Cloud EAM: best for service- and asset-intensive enterprises
Best fit. IFS Cloud EAM suits asset-intensive enterprises where assets, services, and operations are tightly coupled. It is delivered as a cloud product.
Executive reporting. IFS Cloud EAM is organized around the whole asset lifecycle, from design through decommissioning, with embedded analytics and an emphasis on lifecycle cost, asset risk, and repair-versus-replace decisions. Its distinctive strength is contextualization: assets can be reported alongside the service and operational processes around them.
Depreciation and financial reporting. IFS emphasizes lifecycle cost and asset risk rather than statutory accounting. We found no documentation establishing an operational depreciation schedule within IFS Cloud EAM, and statutory depreciation should be treated as part of the finance layer. Ask IFS which finance component owns the depreciation calculation, whether it is required alongside EAM, and the direction in which values flow.
Downtime and reliability. Native, with configuration determining which metrics are available and how downtime is categorized.
Asset health. This classification is the one most likely to be misread. IFS documents Asset Performance Management in IFS Cloud EAM as providing predictive control over asset health by combining real-time condition monitoring with AI-driven insights, and it states that the capability requires IFS Operational Intelligence integration. Basic condition and inspection records are one thing; APM-grade health is another, and it carries the same dependency. A health dashboard is not automatically predictive maintenance, and a machine can carry a poor condition score without any software predicting when it will fail.
Integrations, data access, and security. IIFS provides strong enterprise, service, and industrial connectivity, with support for external BI and enterprise identity and audit controls. Because IFS spans EAM, service management, and enterprise operations, map which modules are in scope before comparing reporting coverage. Confirm multi-site and multi-country behavior for currency, fiscal calendars, and unit handling.
Pricing and packaging. Pricing is quote-based, and the figure depends heavily on module scope rather than user count alone.
Primary limitation. Complete coverage across financial, operational, and predictive reporting depends on module and integration choices that need pricing before the shortlist closes. Broader IFS deployments typically involve enterprise-level implementation work rather than lightweight configuration.
Verdict. IFS fits organizations whose assets cannot be reported in isolation from service delivery, and its lifecycle-cost and asset-risk framing maps closely to repair-or-replace decisions. The trade-off is that the health capability most buyers want depends on Operational Intelligence. Confirm the module scope and the financial architecture before comparing the capability on its own.
5. Oracle Fusion Cloud Maintenance: best for Oracle-centered finance environments
Best fit. Oracle Fusion Cloud Maintenance suits organizations already committed to Oracle Cloud that want maintenance connected to finance, costing, and supply chain. It is delivered as a cloud product.
Executive reporting. Oracle covers asset definition, maintenance history, cost, meters, hierarchies, connected equipment, preventive maintenance, and condition-based maintenance, with analysis and reporting available through Oracle Transactional Business Intelligence. Oracle’s dependencies documentation sets out how maintenance draws on asset lifecycle management, inventory, and other Fusion applications.
Depreciation and financial reporting. Oracle Maintenance is not the depreciation engine. Oracle Fixed Assets handles financial asset accounting, while Oracle Maintenance creates and manages maintenance assets. Oracle’s Maintenance datasheet states that a maintenance asset can be associated with a financial fixed asset, or created and capitalized as a fixed asset on receipt, with the relationship established automatically. That architecture is useful, but it still represents an integration between two separately licensed products.
Downtime and reliability. Ordinary maintenance and work order cost reporting is native. Oracle’s datasheet also describes logical asset hierarchies used to model a plant, production line, vehicle fleet, customer, or location, as well as smart search across asset attributes and the ability to raise work orders from an asset workbench. For executive reporting, hierarchy modeling matters more than it sounds, because it determines whether a site-level number can be assembled at all.
Asset health. Condition monitoring from connected equipment is not a switch inside Maintenance. Oracle’s readiness documentation states that receiving anomaly and prediction events from connected equipment or third-party monitoring systems requires provisioning the SCM Core Service-Smart Operations on the instance via a service request. That is also where Oracle’s predictive maintenance capability sits, which is why both cells are classified as Integration here.
Integrations, data access, and security. Oracle provides deep integration within Fusion across supply chain, customer experience, and ERP Financials, with enterprise identity and audit controls inherited from the platform. Outside Fusion, integration should be treated as a project rather than a configuration step.
Pricing and packaging. Pricing is quote-based, and depreciation reporting means licensing Fixed Assets alongside Maintenance.
Primary limitation. The financial half of the reporting story lives in a different product, and the condition-monitoring half requires an additional provisioned service.
Verdict. Oracle demonstrates the asset decision triangle better than most because technical condition, maintenance expenditure, and financial consequence can genuinely be considered together. The trade-off is that assembling that view requires licensing maintenance, fixed assets, and a smart operations service, so price the combination rather than the maintenance product alone.
6. Octave Attune EAM: best for reliability-led industrial operations
Best fit. Octave Attune EAM suits industrial organizations with mature reliability practices, particularly in regulated environments. It is available as a cloud or on-premises deployment. Attune EAM is the rebranded HxGN EAM under Octave, as the software business separates from Hexagon. Expect to see all three names in older evaluation material.
Executive reporting. Attune EAM covers asset lifecycle management, maintenance, reliability, maintenance-repair-and-operations inventory, reporting, and analytics. It is commonly evaluated for asset hierarchy, maintenance planning, inspection workflows, and audit trails where documenting asset changes and maintenance actions is itself a requirement..
Depreciation and financial reporting. We could not establish depreciation or book value reporting from current primary evidence, so both the operational schedule and statutory accounting are recorded as not publicly verified. Treat financial reporting as an open question to resolve in a demo.
Downtime and reliability. Downtime reporting is native and the primary reason the platform earned a place on this list. Confirm which downtime categories and reason codes are standard and which are configured. Octave’s published EAM material describes reliability reporting in general terms but does not name MTBF or MTTR as calculated metrics, so those are recorded as not publicly verified rather than assumed.
Asset health. This is a common terminology trap. Octave separates Attune EAM from Attune APM, formerly HxGN APM, which houses quantitative risk analytics, failure prediction, real-time equipment health monitoring, and the embedded asset-strategy library. Deeper health analytics are therefore a separate product purchase, not an EAM capability, and the two should never be collapsed into a single native rating.
Integrations, data access, and security. Attune provides robust industrial system and sensor connectivity, particularly for APM, along with audit trails suited to regulated documentation requirements.
Pricing and packaging. Pricing is quote-based. Budget evaluation should include Attune EAM and Attune APM together when advanced health and predictive capabilities are required.
Primary limitation. The capability most buyers associate with asset health sits in the adjacent product, and the financial reporting picture is not publicly documented.
Verdict. Attune fits organizations with real reliability maturity, especially where audit trails and inspection records matter as much as dashboards. Evaluate it as EAM plus APM from the start, because assessing Attune EAM alone will understate both the capability and the cost.
7. IFS Ultimo: best for configurable enterprise maintenance reporting
Best fit. IFS Ultimo suits organizations that require highly configurable maintenance processes and reporting. It is delivered as a cloud product.
Executive reporting. Ultimo covers planning, execution, service levels, cost, failure causes, and maintenance KPIs, and users can build list reports without technical skills and share them as templates. Ultimo’s dashboards and reports documentation states that standardized KPI dashboards powered by Microsoft Power BI are offered in the Professional product version and higher. They cover open and executed activities, corrective and preventive maintenance, costs and budgets, and asset availability, with filtering and data drill-down. Technical provisions for a customer-built BI environment using Power BI, Tableau, or another tool are available from Premium and higher. The published pages do not state whether those dashboards are included in each edition or sold as a paid option, so confirm that in a quote rather than assuming the capability is bundled.
Depreciation and financial reporting. Not documented at the capability level. Financial lifecycle reporting should be treated as an integration to the finance system and confirmed directly.
Downtime and reliability. Downtime reporting is native and includes failure-cause statistics. Ultimo’s published dashboard documentation does not name MTBF or MTTR as calculated metrics, so those are recorded as not publicly verified. A dashboard that displays data is not evidence that the platform calculates a specific metric.
Asset health. Instead of providing a fixed health score, health reporting is dynamically generated based on specific inspections and condition records. Where a health indicator is built through configuration, ask who owns its definition and what happens to historical comparability when that definition changes.
Integrations, data access, and security. Power BI and Tableau at the appropriate edition, plus standard enterprise integration and access controls.
Pricing and packaging. Pricing is quote-based, and reporting capability is tiered by product version, so establish which edition your intended dashboards require before comparing quotes.
Primary limitation. Configurability without governance becomes technical debt, and the reporting tier affects pricing in ways that the public pages do not fully disclose.
Verdict. Ultimo suits organizations that need configurable reporting without adopting the broadest possible suite. The trade-off is ownership: someone has to configure the reports, maintain the definitions, and rework them when the business changes, and a system with 500 custom reports is not better than one with 50 well-designed ones.
8. Aptean EAM: best for manufacturing maintenance teams
Best fit. Aptean EAM suits manufacturers where maintenance sits close to the production line. It is available for cloud or on-premises deployment, depending on the product line.
Executive reporting. Aptean emphasizes asset performance, maintenance, reliability, multi-site visibility, and operational insight across production environments. Its reporting addresses manufacturing questions such as overdue work, asset performance, maintenance activity, and downtime. The evidence base is weaker for this profile: no capability-level Aptean documentation was publicly available at the time of checking. Every classification here therefore rests on product-page evidence rather than on technical documentation, which is a weaker basis than we were able to use for the other seven platforms.
Depreciation and financial reporting. Not publicly verified. We could not source depreciation or book-value reporting, and we are not inferring an architecture from that absence.
Downtime and reliability. Downtime reporting is native and well-suited to the production context. The capability worth testing is whether a downtime event can be linked to production loss rather than reported only as equipment hours. That connection may depend on MES or line-side data, so ask what has to be integrated before it exists. MTBF and MTTR are recorded as not publicly verified.
Asset health. Asset performance and criticality capabilities are described, but no scoring methodology is published. Ask which inputs contribute, how they are weighted, and how often the indicator refreshes. For a manufacturer, the practical test is whether criticality is a static field set at commissioning or a value that responds to failure history, because the latter is more useful for prioritizing capital.
Integrations, data access, and security. Aptean provides ERP and BI connectivity through its wider ecosystem, but access controls should be confirmed against your security requirements given the documentation gap.
Pricing and packaging. Pricing is quote-based, and because reporting packaging is not published, establish in writing which dashboards and analytics are included in the quoted configuration.
Primary limitation. The financial dimension is one of the least documented in this comparison, alongside Octave Attune.
Verdict. Aptean fits where the reporting problem is heavily operational, and maintenance is inseparable from production continuity. The trade-off is the evidence base: with no public capability documentation, more of the verification burden shifts to your demo and proof of concept than with any other platform here.
Financial and governance reporting compared
| Platform | Depreciation schedule | Statutory fixed-asset accounting | Physical reconciliation | Financial system of record |
|---|---|---|---|---|
| EZO EAM | Native [1] | Integration | Limited [15] | ERP or accounting system |
| IBM Maximo | Native [5] | Integration [16] | Not publicly verified | ERP |
| SAP | Not publicly verified [8] | Module [9] | Integration | SAP Asset Accounting |
| IFS Cloud | Not publicly verified | Integration | Not publicly verified | Finance layer, component to confirm |
| Oracle | Not publicly verified | Integration [17] | Integration | Oracle Fixed Assets |
| Octave Attune | Not publicly verified | Not publicly verified | Not publicly verified | Not publicly documented |
| IFS Ultimo | Not publicly verified | Integration | Not publicly verified | ERP |
| Aptean | Not publicly verified [14] | Not publicly verified [14] | Not publicly verified | Not publicly documented |
The final column is descriptive rather than a capability label. It answers the question that determines how reconciliation disputes are resolved: when the EAM and the finance system disagree, which one wins.
Maintenance and reliability reporting compared
| Platform | Executive dashboards | Downtime | MTBF and MTTR | Asset health | Predictive and APM |
|---|---|---|---|---|---|
| EZO EAM | Native [18] | Native [2] | Module [19] | Limited [3] | Not publicly verified |
| IBM Maximo | Native | Native | Module [20] | Module [6] | Module [6] |
| SAP | Native | Native [21] | Not publicly verified | Module [9] | Module |
| IFS Cloud | Native | Native | Not publicly verified | Integration [10] | Integration [10] |
| Oracle | Native | Native | Not publicly verified | Integration [11] | Integration [11] |
| Octave Attune | Native | Native | Not publicly verified [12] | Module [12] | Module [12] |
| IFS Ultimo | Native [13] | Native | Not publicly verified [22] | Limited | Not publicly verified |
| Aptean | Native | Native | Not publicly verified [14] | Limited | Not publicly verified |
Read the MTBF column carefully. Six of these eight platforms are recorded as not publicly verified for MTBF and MTTR. That means we could not source the metric at the capability level in the vendor documentation. It does not mean the metric is absent, and several of these platforms very likely calculate both. It is a quick question to settle in a demo, and the difficulty of settling it from public documentation is itself part of the point.
Commercial comparison
| Platform | Pricing visibility | Trial or evaluation access | Deployment | Reporting add-on required | Finance-system dependency |
|---|---|---|---|---|---|
| EZO EAM | Published, from $63.55 per month at 300 items [4] | 15-day free trial, no credit card | Cloud | CMMS packaging for reliability metrics [19] | Yes, for statutory accounting |
| IBM Maximo | Published starting price, then quote [7] | Demo and quote | Cloud, on-premises, hybrid | Health, Monitor, or Predict [6] | Yes |
| SAP | Quote | Demo and quote | Cloud or on-premises | Asset Accounting for depreciation [9] | Owned inside SAP |
| IFS Cloud | Quote | Demo and quote | Cloud | Operational Intelligence for APM health [10] | Yes |
| Oracle | Quote | Demo and quote | Cloud | Fixed Assets, plus Smart Operations service [11] | Yes |
| Octave Attune | Quote | Demo and quote | Cloud or on-premises | Attune APM for health analytics [12] | Not publicly documented |
| IFS Ultimo | Quote | Demo and quote | Cloud | Power BI dashboards by edition [13] | Yes |
| Aptean | Quote | Demo and quote | Cloud or on-premises | Not publicly documented [14] | Not publicly documented |
Footnotes for all tables
- EZO includes depreciation of equipment on every published plan, documenting straight-line and declining-balance models at the group level, calculated monthly, with salvage value as a field. Statutory fixed-asset accounting remains with the finance system.
- EZO documents downtime and asset diagnostics reporting. Confirm which specific measures appear in your configuration.
- Condition, inspection, and service history are available. No probabilistic health model or remaining-useful-life calculation is published.
- Item-based pricing is published for Essential, Advanced, and Premium; Enterprise is quote-based. Prices were checked at the 300-item level on September 7, 2026.
- IBM documents adding date-based or usage-based depreciation schedules to assets, using straight-line or double-declining methods with a salvage amount.
- Delivered by Maximo Health, Monitor, or Predict rather than Maximo Manage, so these are separately packaged capabilities within the suite rather than base-product features.
- IBM publishes indicative SaaS starting prices, including Maintenance starting under US$40,000 per year at 150 AppPoints for one environment and up to 25 users, on a credit-based AppPoints model. Larger and client-managed deployments are quote and usage-dependent.
- SAP documentation establishes statutory depreciation in Asset Accounting. We found no documentation of an operational depreciation schedule inside the maintenance product.
- SAP Asset Accounting is a Finance component, documented as a subsidiary ledger to the general ledger.
- IFS documents Asset Performance Management in IFS Cloud EAM as providing predictive control over asset health and states that it requires integration with IFS Operational Intelligence.
- Oracle documents that receiving anomaly and prediction events from connected equipment or third-party monitoring systems requires an additional service, SCM Core Service-Smart Operations, which must be provisioned via a service request.
- Attune APM is a separate product from Attune EAM and is where quantitative risk analytics, failure prediction, and real-time equipment health monitoring sit. Octave’s EAM material does not name MTBF or MTTR as calculated metrics.
- Ultimo documents standardized Power BI KPI dashboards in the Professional product version and higher, and provisions for a customer-built BI environment in Premium and higher. The published pages do not state whether the dashboards are included per edition or sold as an option.
- No capability-level Aptean documentation was publicly available at the time of checking. All Aptean classifications rest on product-page evidence.
- Custody and location audits are native to the Advanced plan. Automated matching against a fixed-asset register is not documented.
- Maximo’s depreciation schedules produce transactions for transfer to a finance system, so statutory accounting remains with the ERP.
- Oracle documents that a maintenance asset can be associated with the financial fixed asset, or created and capitalized as one on receipt, with the relationship established automatically. Statutory accounting belongs to Oracle Fixed Assets.
- Standard reports appear on all published EZO plans. Advanced and custom reports are available on the Advanced plan.
- MTTR and MTBF tracking is documented in EZO’s maintenance materials and delivered through CMMS capabilities, packaged separately at Premium or included with Enterprise.
- IBM’s Maximo Health documentation states that MTBF is calculated by dividing the asset’s age since installation by the number of unscheduled work orders in that period, and that it requires an installation date. The Maximo Health 9.0 release note states total operating time divided by failures. Both are IBM sources, and they differ.
- Available subject to configuration of downtime codes and failure definitions.
- Ultimo’s published dashboard documentation does not name MTBF or MTTR as calculated metrics.
Which platform fits which buyer
- EZO EAM: The reporting problem is turning existing asset, location, cost, and maintenance data into management information, and you want to test the reporting on your own data first.
- IBM Maximo: Asset complexity is the problem, and the organization can fund and govern a multi-component suite.
- SAP: SAP already owns the enterprise data architecture, and the gap you are closing sits between maintenance and finance.
- IFS Cloud: Assets cannot be reported in isolation from service delivery.
- Oracle: Finance and maintenance are already live in Oracle, and you can license the combination.
- Octave Attune: Reliability and sophistication are the priority, and APM is in scope and within budget.
- IFS Ultimo: Configurability matters more than suite breadth, and you have the governance to maintain it.
- Aptean: Maintenance sits on the production line, and financial reporting already lives elsewhere.
What executives should see in an EAM dashboard
The strongest executive dashboard does not display more KPIs. It connects financial value, operating performance, and asset risk to the underlying asset, work order, location, and source records.
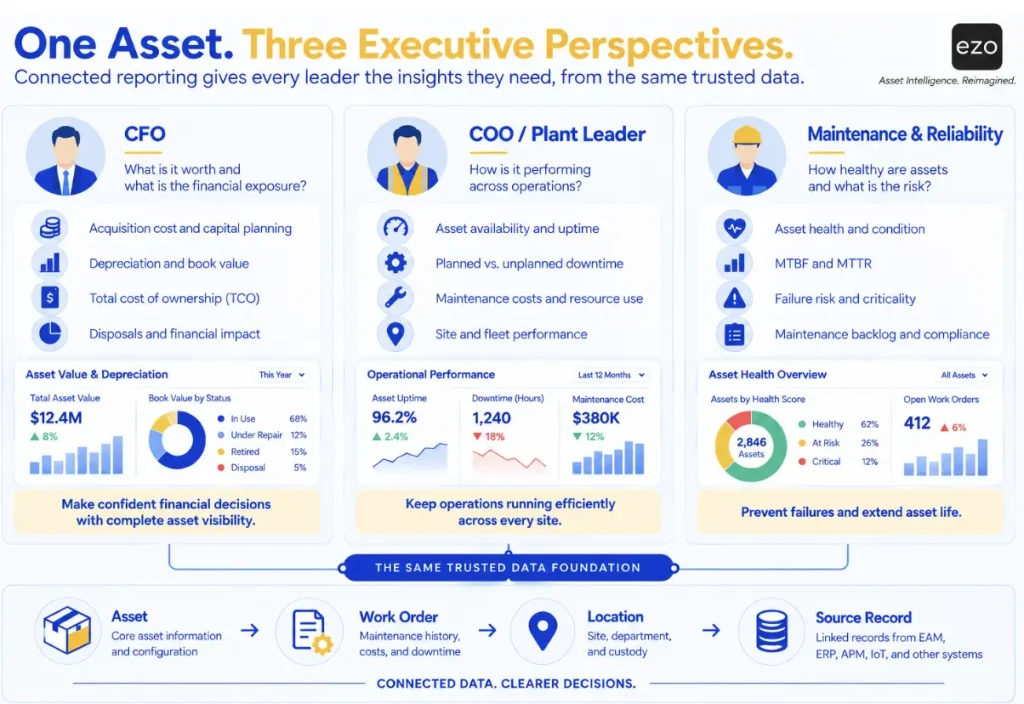
For CFOs: Acquisition and capitalization value, accumulated depreciation, net book value, maintenance expenditure, lifecycle cost, disposal exposure, missing or unverified assets, replacement capital requirements, and asset value by business unit.
A $100,000 maintenance cost might be high for one asset and rational for another, so the useful question is what was spent, on which asset, and relative to the value and performance it delivered.
For COOs and plant leaders: Planned downtime, unplanned downtime, availability, production impact, location-level performance, critical failures, maintenance backlog, and deferred-maintenance risk. The useful question is usually variance: which site differs, and whether the cause is staffing, equipment, maintenance strategy, or data quality. That last possibility is more common than most leadership teams expect.
For maintenance and reliability leaders: MTBF, MTTR, preventive maintenance compliance, repeat failures, backlog age, asset criticality, condition trends, health indicators, and spare parts readiness. Definitions matter more than dashboards here, which is why consistent maintenance KPIs beat additional charts.
Can an EAM system reconcile depreciation records with physical assets?
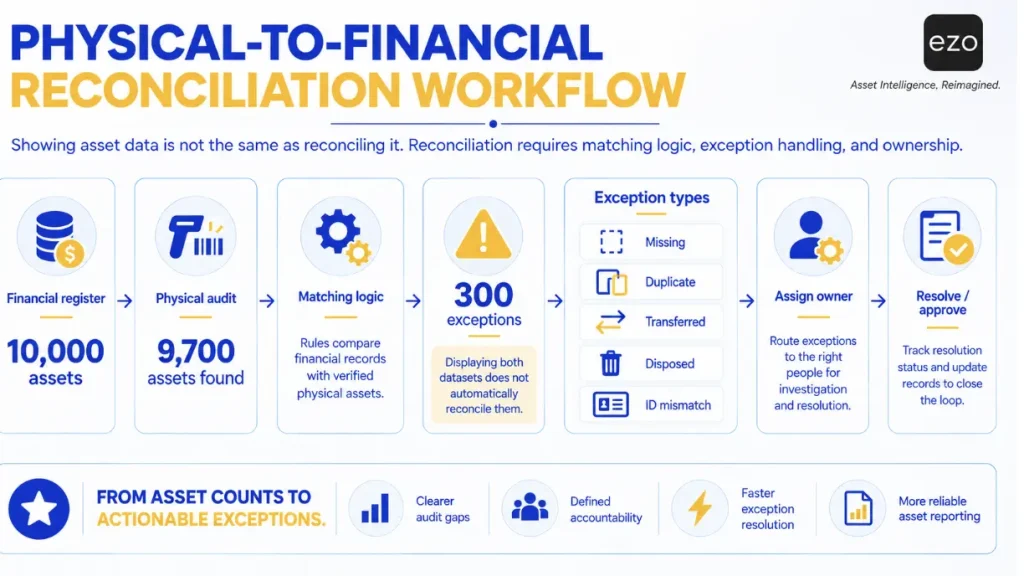
Not necessarily. Supporting depreciation and physical asset auditing does not mean that an EAM performs automated financial reconciliation. Buyers should verify the matching logic, exception handling, synchronization direction, system of record, and approval workflow.
A company owns 10,000 assets. The financial system says 10,000. The physical audit finds 9,700.
That is not merely a reporting discrepancy. It creates 300 unresolved asset exceptions. Are they missing, disposed of but never retired financially, duplicated, transferred to another site, or present under another identifier?
The ability to display both datasets does not mean a system can reconcile them. Strong asset audit and verification practices narrow the gap, but the matching logic still has to exist somewhere, and someone has to own the exceptions.
Ask every vendor:
- Which system remains the financial system of record?
- Can the EAM match physical audit results against the fixed-asset register?
- Can it flag missing, duplicate, retired, or unverified assets?
- Is depreciation calculated natively, imported, or displayed only?
- How often does financial data synchronize, and in which direction?
- Can a dashboard number be traced to individual records?
- Can exceptions be assigned, investigated, approved, and resolved inside the platform?
The question is not whether the organization owns an asset. It is whether it can prove what it owns, where the asset is, what it is worth, how it performs, and who is accountable. Public-sector and grant-funded organizations feel this most acutely because asset custody and audit documentation are obligations rather than preferences.
How to evaluate an EAM reporting dashboard in a demo
A vendor demonstration creates an information asymmetry: the vendor knows what the software does, the buyer knows what they hope it does, and the salesperson controls the sequence. This makes it easy to leave impressed without verifying anything. Make it a controlled experiment instead, and ask every vendor to demonstrate rather than describe.
Financial
- Depreciation or book value for one selected asset, and the source of that data.
- Which system owns statutory depreciation, as shown in the architecture?
- A physical asset that does not match the financial record is shown as an exception.
Operational and reliability
- A consolidated multi-site executive dashboard.
- Planned and unplanned downtime for one asset.
- MTBF and MTTR, with the failure definition and calculation formula stated explicitly.
- Maintenance expenditure for that asset.
- The exact inputs behind any health score and how often it refreshes.
Data provenance
- A drill-down from an executive KPI to its source records.
- The three-level traceability check below is run live on one number.
Administration and export
- A custom report built without vendor professional services.
- A scheduled report distributed to an executive.
- Data export or connection to your BI environment.
- Permissions separating financial, operational, and technician access, plus the process for correcting inaccurate asset records.
The three-level traceability check
Every executive number should have three accessible levels. Ask for all three on one asset, in one sitting:
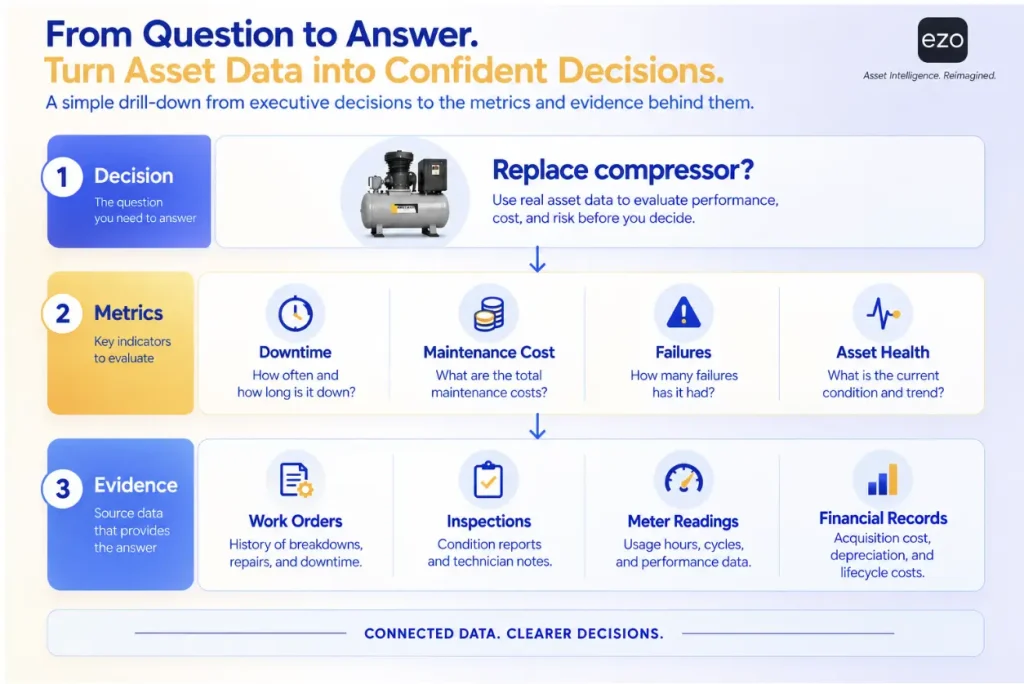
- Decision: Should we replace this compressor?
- Metric: It has generated $X in maintenance costs, Y hours of unplanned downtime, and Z failures.
- Evidence: Here are the work orders, downtime events, inspection readings, and financial records behind those figures.
The higher the stakes of the decision, the more important the lower levels become. When a $2 million capital decision rests on a health score, someone must be able to ask why the system considers the asset unhealthy and get an answer within minutes.
The proof of concept test
Use your own data. A representative dataset should include multiple sites, active and retired assets, purchase and depreciation information, one deliberately omitted physical asset, planned and unplanned downtime, work order and inspection history, meter or condition readings, and different executive roles. Then give every shortlisted vendor identical questions.
EAM reporting pricing and implementation
The lowest subscription price does not produce the lowest reporting cost. Executive dashboards depend on clean asset hierarchies, consistent downtime codes, reliable financial integrations, and ongoing data governance.
Total reporting cost typically includes the subscription, analytics or APM modules, plan upgrades that unlock custom reporting or API access, ERP integration, BI connectors, data migration, asset-master cleansing, dashboard configuration, training, administration, and ongoing report maintenance.
A workable way to hold all of it together:
Subscription + implementation + integration + data governance + internal reporting and reconciliation labor
The last term is the one most models omit, and it is estimable. Count the hours your team currently spends producing and arguing about asset numbers, multiply that by the loaded labor cost, and annualize the result. If two analysts each spend six hours a month rebuilding asset reports in spreadsheets at a loaded cost of $60 an hour, that is roughly $8,600 a year before anyone reconciles a discrepancy. Run the same calculation against each shortlisted platform’s expected manual effort.
That is why a platform that costs $50,000 less may not be the cheaper option. A cheaper license that leaves four people reconciling records for six months can consume the savings before the first board report goes out. Our asset management software comparison argues for modeling three year total cost across licensing, implementation, integration, administration, and support, and this is the term to add to it.
Why does the reporting environment change the decision
A dashboard tells you something. A decision system helps you work out what to do.
Asset A, dashboard view: MTBF 480 hours, MTTR 8 hours, downtime 126 hours, maintenance cost $94,000, health 61%. Accurate, but inert.
Asset A, decision view: MTBF declining for three consecutive quarters, unplanned downtime rising, maintenance cost growing faster than utilization, condition deteriorating, replacement cost $240,000, current book value $80,000. Now the trade-off is visible.
The software has not decided anything. It has changed the information environment in which decisions are made, and several predictable biases can shape these decisions.
Replacement cost appears as a single visible number in a capital budget, while the cost of keeping an aging asset is dispersed across downtime, emergency labor, parts, lost production, and safety exposure. The visible number feels like a loss, whereas the dispersed cost does not, pushing organizations toward inaction. Making the cost of inaction as legible as the cost of replacement can help counterbalance that. Organizations also become attached to familiar assets, and familiarity and accumulated knowledge can carry real value that is easily confused with economic value. Purchase price should not become the default measure of worth, and the most recent failure should not become the default estimate of failure frequency.
Finally, examine what your dashboard causes managers to optimize. A dashboard that celebrates work-order closure encourages closure; a dashboard that examines recurring failures encourages reliability. Those are different objectives, and the distinction between corrective and preventive work is where it shows up. The ISO 55000 family of asset management standards makes a related point in governance terms: assets exist to deliver value, and value must be measured against objectives rather than by asset count. Our summary of those asset management principles explains how they translate into a register.
Final verdict
There is no universally best EAM reporting platform. The right choice depends on where an organization sits between accessibility, enterprise complexity, financial integration, maintenance sophistication, and analytical depth.
EZO EAM is the accessible option where the requirements are asset lifecycle, location, cost, maintenance, and multi-site reporting, and where published pricing and trial access matter. IBM Maximo suits highly complex industrial estates and includes a documented operational depreciation schedule, in addition to its reliability. SAP and Oracle become attractive when the financial architecture is already built around them, with statutory depreciation living in Asset Accounting and Fixed Assets, respectively. IFS Cloud fits asset- and service-intensive environments, with an Operational Intelligence dependency for APM-grade health. Octave Attune fits mature reliability programs with APM in scope, and Ultimo and Aptean suit configurable maintenance and operational reporting.
The decisive question is whether each metric you need is native, module-based, integrated, or manually assembled, and how many steps separate the insight from the decision. Answer it with a proof of concept built on your own depreciation, downtime, and condition data. If EZO EAM is on your shortlist, the trial below is the fastest way to run that test on your own records.
See your asset data in one operational view
Your assets represent financial investment, operational capacity, and future risk simultaneously. EZO EAM helps organizations track and understand those assets across their lifecycle: where they are, how they are used, what they cost, how they are maintained, and how their performance changes. Review the documented capabilities, customer case studies, and current plans before speaking to anyone.