
Effective spare parts inventory management starts by classifying each part based on the operational consequences of a stockout, its demand pattern and variability, the difficulty of replenishment, and the cost or risk of holding it. The policy should then connect each part to the asset and maintenance work it supports, use lead time and demand to set replenishment controls, maintain accurate location records, and measure whether required parts are available when and where maintenance needs them. The objective is appropriate availability for each risk class, not maximum or minimum inventory.
Key takeaways
- Stocking priority should reflect operational criticality, demand behavior, replenishment risk, and holding exposure, not part cost or usage alone.
- ABC, XYZ, VED, and FSN classifications answer different questions, so no single method should determine spare-parts policy.
- Preventive maintenance makes planned parts demand visible, while unpredictable breakdown demand requires separate, risk-based stocking decisions.
- Inventory accuracy requires both correct quantities and locations. Stock that technicians cannot find does not protect uptime.
- Reorder points suit predictable consumption, while rare, critical spares require decisions based on consequence, lead time, redundancy, and sourcing options.
- Spare-parts KPIs should be segmented by criticality, site, and part class because aggregate metrics can conceal operational risk.
A maintenance work order can be diagnosed correctly, assigned to the right technician, and scheduled at the right time, yet remain unfinished because one required part is unavailable. The delay may begin with a true stockout. It may also begin with a record showing stock that does not exist, an incorrect bin location, or a description that directs the technician to an incompatible component.
The intuitive response is to carry more inventory. This reduces some stockout risk but creates another set of problems: capital tied up in parts that may never be used, expired shelf life, stock made obsolete by equipment changes, and crowded storerooms where the right item is harder to find. Inventory management practices built around frequent consumption, where a shortage means a lost sale or delayed order, transfer only partly to maintenance spares. Demand for maintenance parts may be intermittent, and a single missing part can keep equipment unavailable for weeks.
That is the trade-off. Maintenance needs enough availability to protect equipment and keep scheduled work moving; the organization needs to control holding costs, emergency purchasing, and obsolescence. A useful policy, therefore, needs to answer four questions:
- What to stock: Which parts are critical enough to warrant inventory?
- How much to stock: What quantity provides appropriate availability without creating unnecessary excess?
- Where and when should it be available? Where should parts be stored, and when must they be accessible to support maintenance work?
- How to measure performance: How will the organization know whether the policy is working?
What spare parts inventory management means
Spare parts management encompasses the processes of identifying, purchasing, storing, locating, issuing, replenishing, reconciling, and retiring the components used to maintain or restore physical assets. It is part of maintenance, repair, and operations (MRO) inventory management.
The process begins with a reliable part record that consistently identifies the component, specifies where it is stored, and links it to the equipment it supports. Around it sit supplier and lead-time data, stock policies, receipts, issues, returns, transfers, reservations, counts, purchase orders, spare-parts bills of materials, job plans, maintenance consumption records, and periodic reviews of parts no longer expected to be used.
Maintenance spares fall into several common management categories, which often overlap. A rotable can be critical, and a repair part can be an insurance spare:
- Consumables are frequently used items such as filters, lubricants, seals, belts, and fasteners.
- Repair parts are components replaced during corrective or preventive maintenance.
- Critical spares are components whose absence would stop or endanger the asset they support, regardless of how often they are consumed.
- Insurance spares are held despite very low expected usage because the consequences and lead time justify the capital cost. Some insurance spares are critical spares; not all critical spares are insurance spares.
- Repairable or rotable components cycle through use, repair, return, and reuse, so the team tracks stock levels and repair turnaround times.
Maintenance inventory differs from production inventory in one important respect. Production inventory exists to become part of planned output. Maintenance inventory exists to protect the ability to operate and recover. Demand may appear only when equipment fails, and the cost of a stockout may bear little relation to the part’s price.
A low-cost filter used every week and a high-cost controller used once in five years cannot be managed by the same rule. The filter is a replenishment problem, whereas the controller is an operational-risk decision.
How spare parts problems turn into maintenance downtime
Inventory does not reduce downtime by existing on a shelf. It protects uptime only when a technician can move through the parts process without delay:
Maintenance need → Identify part → Confirm availability → Locate → Issue → Complete repair
Each handoff can fail in a different way.
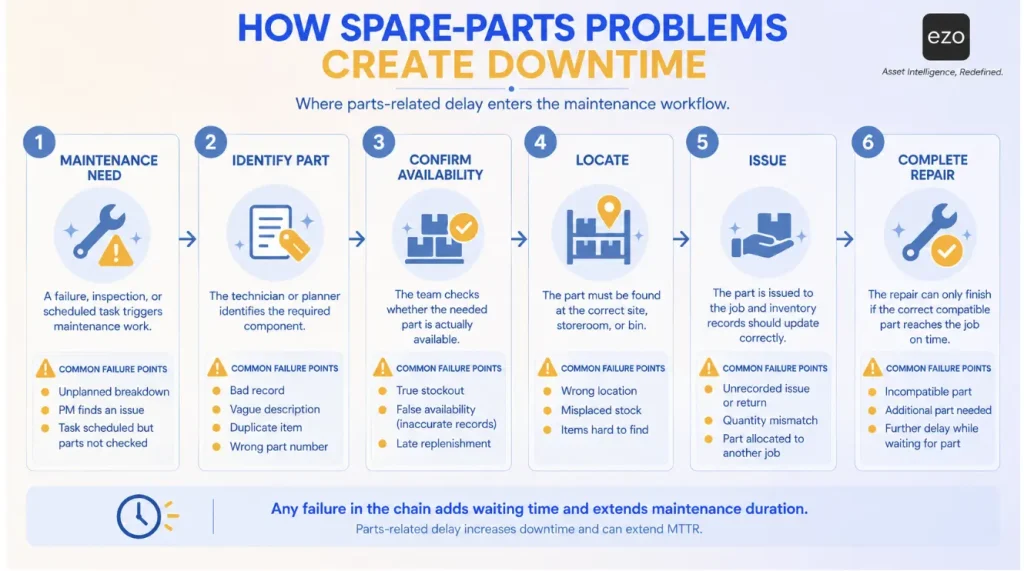
| Failure mode | What happens operationally | Effect on maintenance |
|---|---|---|
| True stockout | The required part is unavailable | Repair waits for procurement or substitution |
| False availability | The system shows stock that cannot be located | Technicians search, recount, and escalate before ordering |
| Wrong location | Stock exists at another site, store, or bin | Transfer or travel extends waiting time |
| Dirty part record | Duplicate or vague records hide usable stock | The team buys again or selects the wrong item |
| Compatibility gap | The stocked component does not fit the asset | Work stops after picking or installation begins |
| Late replenishment | Reordering starts after the final unit is consumed | The repair inherits the supplier lead time |
| Unrecorded issue or return | The on-hand balance no longer reflects reality | The next job is planned against inaccurate data |
| Obsolete stock | Inventory supports retired or modified equipment | Capital and space create an illusion of coverage |
Consider a system showing five seals in stock. If all five were issued without recording the transaction, the apparent stock is not a weaker version of availability. It is false information. The team may then schedule work, release equipment, and allocate labor based on nonexistent stock. The error changes a maintenance decision, not just a stock balance. That is why inventory-tracking discipline belongs to maintenance, not just to stores.
Parts-related waiting time extends mean time to repair (MTTR), but inventory is only one component of MTTR, alongside diagnosis, access, labor, permits, tools, testing, and restart. Asking what share of all equipment downtime inventory causes leads nowhere. Instead, measure how much maintenance duration is spent waiting for a part and which failure in the parts process created the wait.
The Uptime Stocking Framework
No single classification or formula decides the right policy for every spare. ABC analysis identifies the items carrying the most annual consumption value. XYZ analysis separates predictable demand from intermittent demand. Neither tells a maintenance manager what happens if a particular part is unavailable.
Research on spare-parts criticality makes the distinction explicit. A part that looks important from an inventory perspective may not be the part that matters most to maintenance. The importance of maintenance rests on the consequences of unavailability, while an inventory view weighs value, movement, and holding costs.
The Uptime Stocking Framework brings those perspectives into one decision. It is an EZO synthesis based on established maintenance-inventory principles, not an industry standard or a statistical model. Evaluate each part across four dimensions.
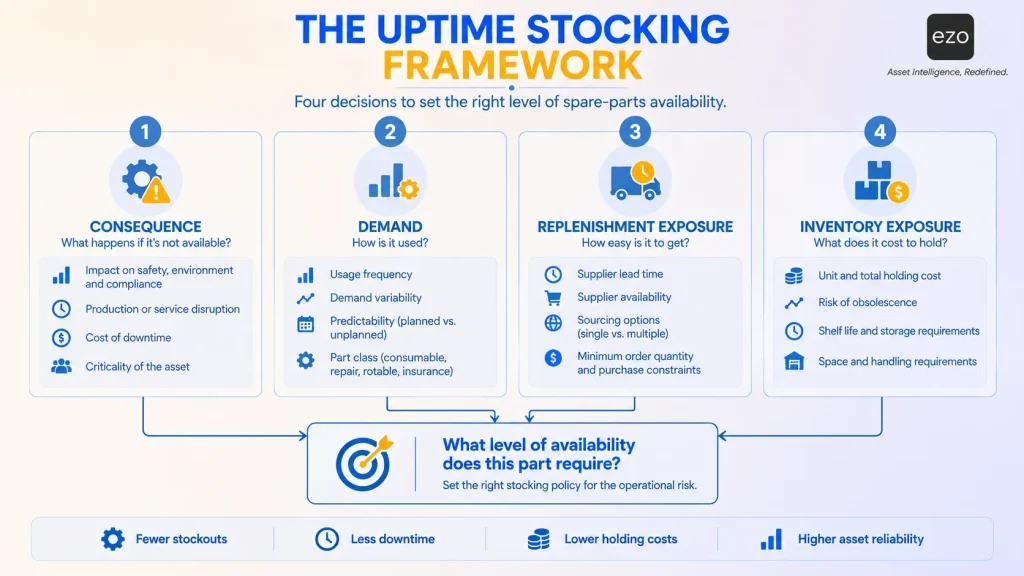
Consequence
Ask what happens if the related asset fails and the part is unavailable. Consider production or service interruption, safety, compliance, customer commitments, revenue exposure, and redundancy. A component supporting the only air compressor on site has different consequences than the same component supporting one of five interchangeable units.
Demand
Examine how often the part is used and how predictable that use is. Planned replacements, preventive maintenance frequency, failure history, equipment population, and seasonality create patterns. Other parts have intermittent demand: long periods of no use, then a failure that requires immediate availability.
Replenishment exposure
Measure how difficult it is to obtain or restore the part. The relevant value is the actual lead time, not the number entered in the item master years ago. Supplier reliability, alternative sources, geography, expediting options, and repair turnaround all affect exposure.
Inventory exposure
Consider what the organization gives up or risks by holding the part. Unit cost matters, but so do storage requirements, shelf life, preservation, deterioration, and obsolescence when equipment is modified or reaches the end of its asset lifecycle.
The four dimensions lead to a practical question: What level of availability should this part receive, and which policy provides it at an acceptable cost?
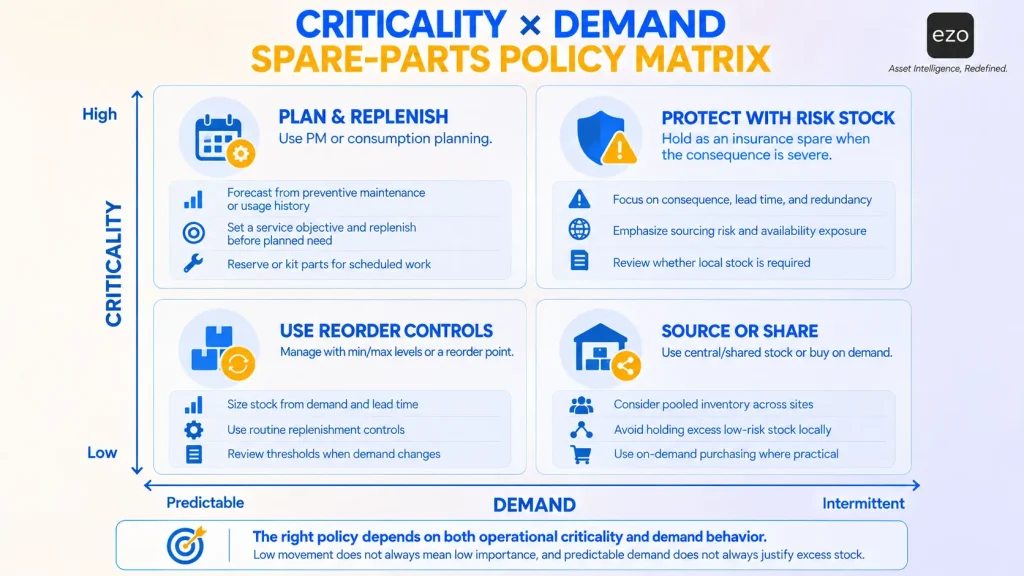
| Part profile | Policy direction |
|---|---|
| High criticality and predictable demand | Forecast from preventive maintenance or consumption, set a service objective, and replenish before the planned need |
| High criticality and intermittent demand | Treat as risk inventory or an insurance spare and emphasize consequence, lead time, redundancy, and sourcing options |
| Lower criticality and predictable demand | Use appropriately sized min and max levels or a reorder point based on consumption and lead time |
| Lower criticality and intermittent demand | Consider central or shared stock, non-stock status, or on-demand purchasing |
The matrix explains why low movement does not justify low stock when the alternative is a 30-day outage, and why high movement does not justify excess stock when several suppliers can deliver the next day.
How to apply the framework
Work through the four dimensions one part at a time, choose a policy, set a review date, and record the reasoning. The framework structures a judgment rather than producing a score, so the written reason is the output. Start with the assets carrying the highest operational consequences, including safety, regulatory, service, and production impacts.
Common policy options include stocking locally, stocking centrally and sharing, holding safety stock, holding an insurance spare, replenishing against min-max levels, reserving or kitting for planned work, sourcing on demand, qualifying an alternate supplier, or not stocking. The output is a short record rather than a model:
| Field | Example |
|---|---|
| Asset | Critical production air compressor, no redundant unit |
| Part | Replacement controller |
| Consequence | Compressor unavailable, production stops |
| Demand | Rare and intermittent |
| Lead time | 30 days, single qualified supplier |
| Substitute | None confirmed |
| Holding risk | High unit cost, moderate obsolescence risk |
| Policy | Hold an insurance spare locally; review it on a set cadence and after any material change in risk. |
| Reason | Low usage does not outweigh the consequences of unavailability and replenishment exposure. |
Local, central, or pooled stock
Multi-site organizations face one more question. Should a critical spare sit at the site that needs it, at a central store, or in a pool that several sites can draw on?
Internal transfer time is usually the first constraint. If pooled stock can reliably reach the equipment within the downtime the operation tolerates, centralizing a high-cost spare may reduce total holdings because several sites share a single unit of coverage. If it cannot, local stock may be necessary. Weigh the inventory savings against transfer costs and reliability, and check whether both sites could need the part at the same time. One shared unit does not cover simultaneous failures. Pooling also needs common equipment, a common part description, and a willingness to release a unit to whichever site needs it more. Organizations managing equipment across multiple locations may gain the most from pooling high-cost, long-lead, low-demand spares.
Nine spare parts inventory management best practices
1. Classify parts by operational criticality
Start with the consequence of unavailability, not the annual consumption value. Combine asset criticality, redundancy, failure impact, demand pattern, supplier options, and lead time. Use ABC and XYZ where they help, but not as substitutes for criticality.
Consider a controller for a critical air compressor. It fails rarely, costs more than routine consumables, takes 30 days to obtain, and has no confirmed substitute. An FSN classification would mark it as slow-moving. An ABC classification might rank it high on value. Neither says what happens when the compressor stops, and that is the decision: one failure could idle it for a month.
Several classification methods are in common use, and each answers a narrower question than teams assume:
| Method | What it measures | What it does not tell you |
|---|---|---|
| ABC | Share of annual consumption value, or another stated value criterion | Whether the asset stops without the part |
| XYZ | Demand predictability, from steady to intermittent | The consequence of an unavailable part |
| VED | Whether an item is vital, essential, or desirable to operations | How often is it used, or how easily is it replaced |
| FSN | Movement, from fast-moving to slow-moving to non-moving | Whether non-movement reflects neglect or deliberate holding |
| Operational criticality | Consequence of unavailability, allowing for redundancy | Value, volume, holding cost, or how hard the part is to replace |
No single method sets the policy alone. ABC and FSN help identify excess and obsolescence, XYZ indicates which replenishment approach fits the demand pattern, and VED and operational criticality establish what is at stake. A multi-criteria approach suits spare parts because they differ in demand, value, lead time, obsolescence, and the consequences of stockouts. Classification does not replace judgment; it makes judgment consistent and visible.
Warning sign: Inventory value keeps rising while critical parts continue to run out.
Metric to watch: Critical-part stockout rate or fill rate by criticality class.
2. Clean and standardize the spare parts master
The item master determines whether people can identify what the organization owns. A clear record carries the preferred name, manufacturer, manufacturer part number, specification, unit of measure, approved suppliers and their part mappings, alternate or interchangeable components, and stocking locations.
Inconsistent descriptions create a deceptively simple problem: the organization can own the part and believe it does not. One site records a bearing by dimensions, another by supplier code, and a third by the machine nickname. A search returns three records that each look different, resulting in duplicate purchases rather than a true shortage.
Assign ownership for creating and changing part records, and check for duplicates before adding an item. The objective is not a perfect catalog. It is one that supports reliable identification, organized storage, and predictable replenishment.
Warning sign: The same bearing, filter, or seal appears under several descriptions.
Metrics to watch: Duplicate records, incomplete records, and item-master exceptions.
3. Link parts to assets and maintenance work
A part record becomes more useful when it shows what the part supports. Build validated spare parts lists or bills of materials for critical equipment, and link parts to assets, equipment models, work orders, job plans, and consumption history.
This changes the timing of identification. Without it, a technician may know a machine needs a bearing but not which bearing until the equipment is opened. With a validated asset-to-part record, the team checks compatibility and availability before work starts.
Recording actual consumption against maintenance work orders improves subsequent decision-making. Failure history records the mode, cause, and corrective action. Parts history adds component-level consumption and cost. Together, the equipment maintenance log and parts records can show which component failed, what was installed, how much was consumed, its recorded material cost where costing is configured, and whether consumption is running above expectations.
Warning sign: Technicians repeatedly open equipment or consult one experienced employee to identify routine replacement parts.
Metric to watch: Percentage of critical assets with validated spare-parts lists.
4. Set replenishment controls from risk and current data
Choose the replenishment policy before setting its parameters. A reorder point suits steady consumption, periodic review suits parts ordered on a supplier cycle, and a two-bin system suits low-value fasteners. Rare, high-value spares may be better held as insurance stock or bought on demand. For less predictable or more critical parts, supplement the calculation with the Uptime Stocking Framework.
Then make the parameters describe how demand and supply behave now. A reorder point built on a seven-day lead time fails if actual delivery takes 18 days: the formula can be correct while the policy is wrong because one input no longer matches reality. Review settings after changes in supplier performance, equipment population, preventive maintenance schedules, usage, or criticality. A replenishment rule rests on assumptions, and inventory control holds only as long as those assumptions do.
Warning sign: Reordering begins when the final unit is issued or when emergency purchase orders become routine.
Metrics to watch: Stockout rate and emergency-purchase rate.
5. Use preventive maintenance to forecast known demand
Preventive maintenance converts some parts demand from uncertain to visible. A calendar tells the team when work is due. A job plan naming the required parts turns that calendar into a forward view of material demand, which can be reviewed and replenished before the planned start date.
Keep planned and breakdown demand separate. A filter replaced every 500 operating hours can be forecast using meter-based maintenance; a controller, consumed only after an unpredictable failure, cannot. A single combined average obscures the information that makes each stream manageable.
Warning sign: Scheduled maintenance is postponed because materials are discovered to be missing on the day work begins.
Metric to watch: Percentage of scheduled jobs that start with all required parts available.
6. Maintain accurate stock by site and bin
An organization-wide balance does not indicate whether a part is available for a specific job. Record receipts, issues, returns, transfers, reservations, and adjustments against the actual site, storeroom, and bin. Centralize the system of record while retaining local ownership and location details.
Define the transaction points. Decide when received stock becomes available, when a transfer leaves the sending location, when it becomes available at the receiving location, and how returned material is inspected before re-entry. Otherwise, two sites may both believe they own the same quantity during a transfer.
Location accuracy is part of inventory accuracy. A pump seal in a locked cage or an unidentified technician’s vehicle is physically present but unavailable for the repair that needs it, and bin accuracy deteriorates quickly when stock is moved during a job and returned without recording the new location.
Warning sign: The system shows stock, but technicians cannot locate it without calling several people.
Metrics to watch: Quantity and location accuracy, plus average time to locate a requested part.
7. Count inventory according to risk
Do not give every item the same counting frequency. Count critical, high-value, high-movement, and discrepancy-prone parts more often than low-risk stock. Use periodic full counts when financial controls, regulations, or policies require them, and use risk-based cycle counting as the ongoing test of record accuracy.
Suppose the system shows ten units and the shelf contains seven. Changing the system to seven repairs the balance without explaining the three-unit difference. The cause may be an unrecorded issue, a wrong unit of measure, a transfer error, damage, or theft. Without investigating the transaction failure, the same discrepancy returns.
Regular inventory auditing turns the count into a process control rather than an annual event. Repeated variance in a single location or part class often indicates a workflow that needs correction.
Warning sign: Annual counts produce large adjustments or unexpected shortages.
Metrics to watch: Inventory accuracy and count variance by part class and location.
8. Manage supplier and lead time risk
Inventory policy cannot compensate for every supply problem. Track actual versus quoted lead time, supplier reliability, single-source exposure, alternate parts, expediting options, and repair turnaround for rotable components.
Additional stock is one response to a long or unreliable lead time, not the only one. The organization may qualify an alternate supplier, redesign around a more available component, share stock across sites, or repair a failed unit rather than buy another. Consignment, vendor-managed inventory, repair exchange, and framework agreements move the holding decision to the supplier for selected part classes.
The right control depends on which uncertainty matters. If delivery times vary, safety stock buffers against lead-time variability. If the part has only one supplier and may become obsolete, a last-time buy or redesign decision becomes more critical. Treat supplier risk as part of the stocking policy rather than a separate equipment procurement issue.
Warning sign: Reorder settings still use supplier assumptions entered several years ago.
Metric to watch: Supplier lead-time variance or the percentage of orders delivered within the planning assumption.
9. Review obsolete and excess stock continuously
Obsolete stock rarely announces itself. It accumulates when equipment retires, bills of materials change, supplier part numbers are replaced, or minimum levels stay in place after demand disappears. Trigger a review of those events rather than waiting for a storeroom cleanup.
Low movement alone does not prove obsolescence, because an insurance spare may sit unused for years by design. The question is whether the organization still runs an asset that could need the part, whether it remains compatible, and whether the risk still justifies holding it.
Repairable and rotable spares need their own controls. A unit in the repair loop is neither available stock nor a loss, so track serviceable and unserviceable status, repair turnaround, and the point at which repair stops being cheaper than replacement. Shelf life requires the same discipline, with expiry dates, preservation requirements, and lot traceability recorded for each item. Separate suspected obsolete stock from confirmed obsolete stock, and define how the organization approves transfers, returns to the vendor, repairs, resales, recycling, or write-offs. Removing a valid insurance spare because it has not moved can create far more operational risk than leaving excess consumables on the shelf.
Warning sign: Shelves contain parts for equipment no one can identify.
Metrics to watch: Obsolete-stock value and non-moving inventory value, segmented by criticality.
Reorder points and safety stock for spare parts
A reorder point identifies when replenishment should begin. The baseline relationship is:
Reorder point = expected demand during lead time + safety stock
For a predictable part, expected demand during the lead time can be expressed as the average daily usage multiplied by the supplier’s lead time.
Assume a filter is used at an average of 0.5 units per day, the supplier lead time is 12 days, and the organization holds four units of safety stock. Expected demand during lead time is six units, so the starting reorder point is ten:
0.5 units per day × 12 days + 4 units = 10 units
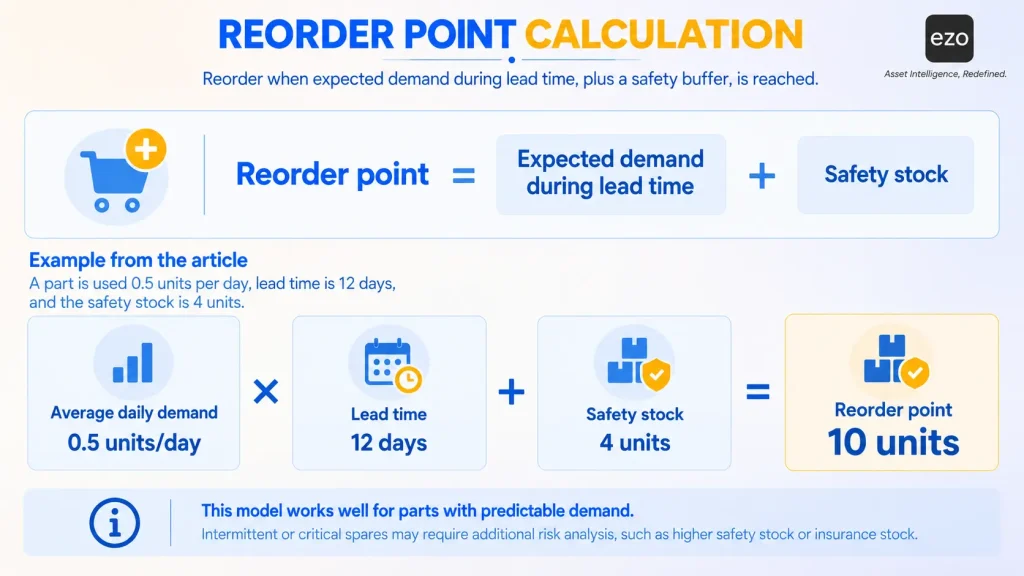
This calculation is easy to run. It assumes that average usage and supplier lead time are representative of future demand, which may hold for a filter consumed regularly across a stable equipment population but is far less reliable for a controller used only when a critical machine fails.
The formula also assumes demand arrives at a steady rate, but many spares do not behave that way. Their demand is intermittent: long stretches of zero consumption broken by one or two units at unpredictable intervals. A moving average can spread that demand over a fraction of a unit per day, resulting in a reorder point below 1 unit and a policy that reorders after a failure occurs. Where the history is long enough to model, intermittent-demand methods such as Croston’s, SBA, and TSB handle the pattern better, though none replaces criticality analysis. Where it is not, treat the part as a risk decision rather than a forecasting problem.
Safety stock absorbs uncertainty in demand, replenishment, or both. It is sized against a service objective, so decide what availability each criticality class should receive before setting the quantity, and set that target from your own downtime cost and tolerance rather than a published benchmark. It should not become an unexplained number carried forward indefinitely. Review it when demand changes, the supplier becomes less reliable, more equipment begins using the part, or planned maintenance creates a known requirement. Where stock is held across several sites, location-based thresholds let each store maintain a level that fits its own equipment and lead time.
For intermittent, expensive, repairable, or highly critical parts, consider consequence, redundancy, alternative sourcing, shelf life, and repair turnaround time. A rare failure with a 30-day lead time may justify an insurance spare even when average daily usage is effectively zero, whereas an expensive, low-criticality part available the next day from several suppliers may be better sourced on demand.
Preventive maintenance and spare parts planning
Preventive maintenance improves parts planning when the maintenance schedule is connected to the materials required for each job. The workflow is straightforward:
Upcoming preventive maintenance → Review required parts availability → Replenish or reserve → Execute work → Record consumption → Update assumptions
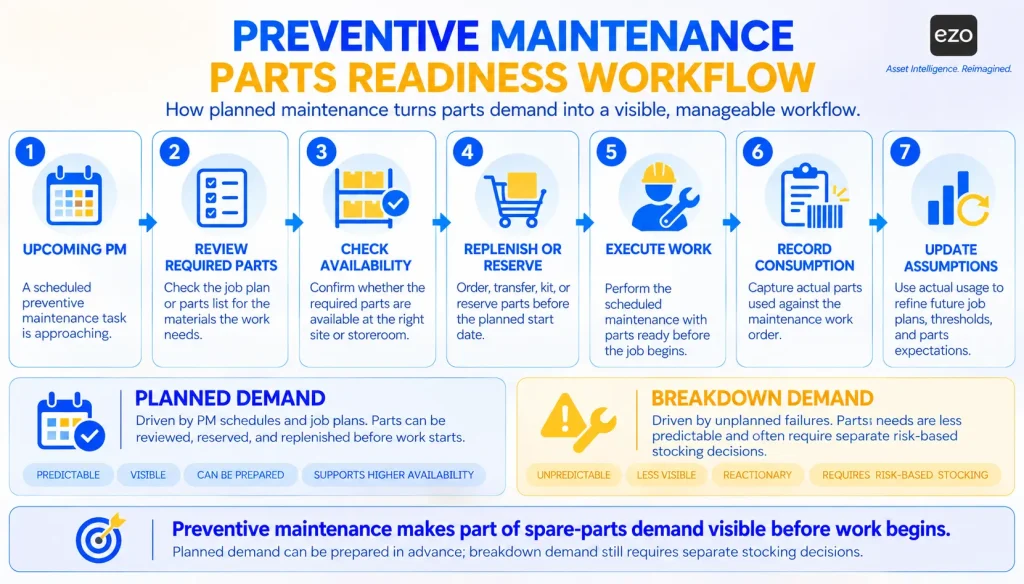
A calendar-based inspection may require a standard kit each quarter, while a meter-based service may require filters every 500 operating hours. Either way, the requirement is visible before the due date if the job plan names the parts.
That forward view turns procurement from a reaction into a preparation step. The planner can compare upcoming requirements with stock by location, order, or transfer material before labor and equipment are committed, and distinguish physically available parts from material already allocated to other work.
After the job, actual consumption should update the history. If a standard service routinely uses two seals rather than one, the next plan should say so. If a listed part is rarely consumed, decide whether the plan is wrong, the part is contingency material, or technicians are not recording usage.
Preventive maintenance does not make breakdown demand predictable. It separates demand that can be known in advance from that which cannot, thereby converting part of an otherwise uncertain material requirement into scheduled demand.
Spare parts inventory KPIs that protect uptime
The purpose of measurement is to test whether the stocking policy supports maintenance at an acceptable cost. A high inventory value does not prove availability, and a high turnover rate does not prove that critical spares are protected. The metrics have to be read together and against records that physical counts have confirmed.
| KPI | What it reveals | Warning sign or interpretation |
|---|---|---|
| Quantity and location accuracy | Whether the system quantity and bin location match physical reality | Repeated shelf-versus-system differences |
| Stockout rate | How often is a requested part unavailable | Stockouts among critical parts or an upward trend |
| Request fill rate | How often is a part request filled immediately and in full | Decline by site or criticality class |
| Emergency-purchase rate | How often does procurement have to expedite or bypass normal planning | Rush buying becomes routine |
| Planned-work parts readiness | Whether scheduled jobs have all required parts before the start | Preventive work is delayed for materials |
| Parts-related waiting time | How much maintenance duration is spent waiting for parts | Long waits on critical work |
| Supplier lead-time variance | Whether the planning data matches the actual delivery | Actual lead time exceeds the item record |
| Obsolete inventory value | Capital tied to parts no longer expected to be used | Stock remains linked to retired assets |
| Inventory value | Capital held by site, category, or criticality | Value rises without a service improvement |
| Inventory turnover | Movement relative to average stock | Low turnover may be intentional for insurance spares |
Each of these benefits from a stated formula, calculated over the same reporting period at every site:
- Quantity accuracy = matching quantity records / records counted × 100
- Location accuracy = records found in recorded location / records counted × 100
- Stockout rate = unfilled part requests / total part requests × 100
- Request fill rate = requests filled immediately and in full / total part requests × 100
- Emergency-purchase rate = expedited or unplanned purchase orders / total purchase orders × 100
- Inventory turnover = cost of parts issued / average inventory value
- Obsolete-stock ratio = confirmed obsolete inventory value / total inventory value × 100
- Non-moving inventory ratio = non-moving inventory value / total inventory value × 100
Two of those splits are deliberate. Quantity and location are measured separately because a part counted correctly but stored in the wrong bin is not available to the job that needs it, and the two failures have different causes and fixes. Obsolete and non-moving stock are also separated because non-moving stock is a prompt to investigate, not a finding in itself. A deliberate insurance spare may remain non-moving for years without being obsolete, so it should not be grouped with obsolete stock.
Agree on the denominators before the first report is published. A stockout rate calculated on requisitions behaves differently from one calculated on work orders. An emergency-purchase rate based on order counts can also be skewed by a single consolidated purchase order, so teams may prefer to use order lines or emergency spend. Whichever basis is chosen must remain consistent across sites.
Classification rules matter just as much. A 98 percent fill rate can conceal repeated failures in the two percent of requests supporting the most critical assets, and a poor turnover result may stem from a single deliberate insurance spare that has never been issued. Neither aggregate explains whether the policy is working, which is why these inventory KPIs should be cut by class before review.
Review them diagnostically: which criticality class is stocking out, which site has the largest location variance, which supplier creates the widest lead-time gap, and which preventive jobs are delayed for materials. Those questions turn inventory reports into action.
How EAM software supports spare parts inventory management
A capable enterprise asset management or computerized maintenance management system should connect the records that the parts process depends on: parts, locations, assets, work orders, preventive maintenance, purchasing, suppliers, consumption history, and reporting.
Inventory and maintenance describe the same event from different sides. The storeroom records that a seal was issued from stock; the work order records why it was used, which asset received it, and the repair cost. If those records remain separate, the stock balance may be accurate, yet the organization still cannot explain demand. Whether an organization uses a CMMS or a broader EAM platform, those records need to be connected.
EZO EAM maintenance management links parts with work orders and supports preventive maintenance and threshold-based procurement. The EZO knowledge base documents inventory and location management, purchasing, item reporting, low stock alerts, location-based thresholds, and reservations. These capabilities support several practical relationships:
- Part-to-asset history: See which components have been consumed on which equipment.
- Part to work order: Attach planned and actual consumption to maintenance work.
- Part to location: Read availability by site or stock location.
- Part to supplier and purchasing: Connect replenishment with thresholds and approved procurement records.
- Preventive maintenance to upcoming work: Review materials before a scheduled job begins.
- Consumption to maintenance history and cost: Use actual usage as evidence for future planning.
Software does not determine the right policy by itself. Criticality definitions, item-master ownership, transaction discipline, and review rules still belong to the organization. The system makes the policy repeatable and exceptions visible. It should not be assumed to predict demand, adjust inventory autonomously, or create purchase orders without user action unless the configured workflow has been verified. Teams still comparing platforms can review the trade-offs among maintenance management software options.
A 90-day plan to improve spare parts management
The first 90 days should establish one controlled management cycle. The goal is not to perfect every SKU, but rather to create reliable records, initial policies, and a review process to improve them.
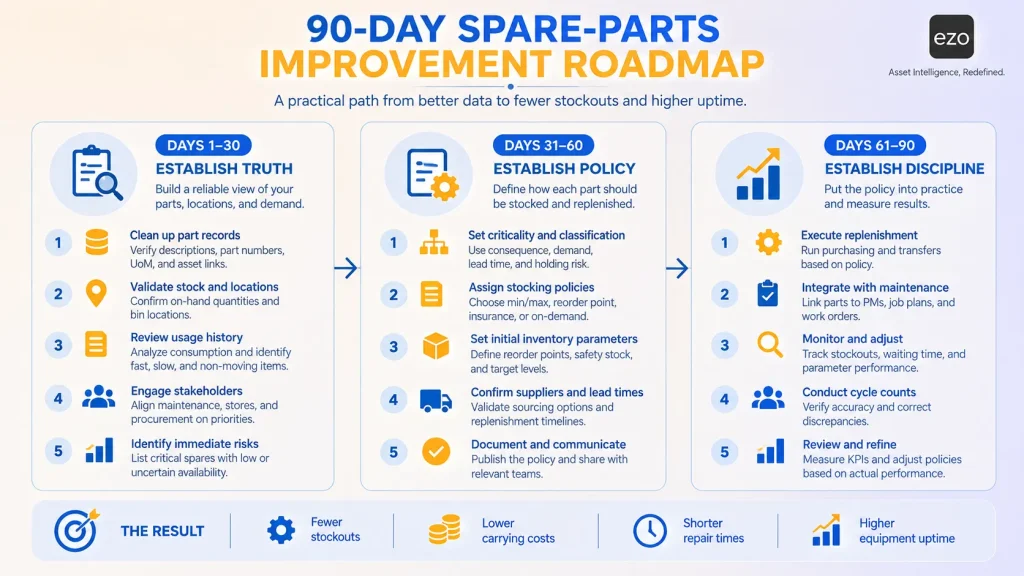
Days 1 to 30: Establish truth
- Count current stock and identify quantity and location discrepancies.
- Clean duplicate and incomplete part records.
- Define sites, storerooms, and bins.
- Identify critical equipment and the spares that protect it.
- Separate suspected obsolete stock for review; do not delete it prematurely.
Start with the parts and assets carrying the greatest operational consequences. Cleaning thousands of low-risk records can consume the month while critical stock remains unreliable, so focus the first audit on the records maintenance it depends on.
Days 31 to 60: Establish policy
- Link parts with assets, work orders, and preventive maintenance plans.
- Validate supplier lead times and alternate sources.
- Set initial min and max levels or reorder points.
- Define safety-stock and insurance-spare rules.
- Assign cycle-count frequencies by risk.
- Add expected parts to preventive maintenance job plans.
Record the assumptions behind each policy. If a controller is held locally because the lead time is 30 days and there is no redundant equipment, those facts should be visible during review.
Days 61 to 90: Establish discipline
- Require consistent records of issues, returns, and transfers.
- Capture consumption against work orders.
- Begin risk-based cycle counts.
- Review stockouts, emergency purchases, and parts-related waiting time.
- Adjust thresholds using observed demand and supplier performance.
- Assign ownership for item-master quality and obsolete-stock review.
On day 90, review where reality differed from the assumptions behind the initial policy. The first policy will not be perfect. Its value is a documented starting point, measurable exceptions, and a reasoned basis for the next adjustment.
Build parts availability into the maintenance workflow
The smallest storeroom is not automatically the most efficient, and the largest storeroom is not automatically the safest. A useful spare-parts policy gives maintenance the level of availability justified by the operational risk each part represents.
That requires more than stock. Each part has to be identified correctly, stored where technicians can reach it within the required response time, replenished before available stock falls below upcoming demand, and recorded against consumption so the next decision is better informed.
EZO EAM can connect spare parts with assets, work orders, maintenance schedules, inventory locations, and purchasing, helping teams prepare materials earlier and investigate parts-related delays. Review the documented workflow, then test it using the parts, locations, and maintenance jobs that pose the greatest risk in your operation. Start a 14-day trial to connect parts, work orders, and replenishment in one system, or book a demo to walk through the workflow with our team.
How was this guidance developed
The process description and part categories follow established maintenance and MRO practices, including IBM’s overview of spare parts management. The distinction between inventory importance and maintenance criticality, and the case for evaluating multiple criteria rather than one, draw on Molenaers, Baets, Pintelon, and Waeyenbergh, “Criticality classification of spare parts: a case study”, International Journal of Production Economics (2012), and on “Spare parts’ criticality assessment and prioritization for enhancing manufacturing systems’ availability and reliability”, Journal of Manufacturing Systems (2019), which also documents the intermittent-demand problem.
The Uptime Stocking Framework, the policy matrix, the policy card, and the 90-day sequence are EZO’s synthesis of those principles, not an external standard. EZO capability statements reflect current product documentation, and the examples are illustrative rather than customer data.