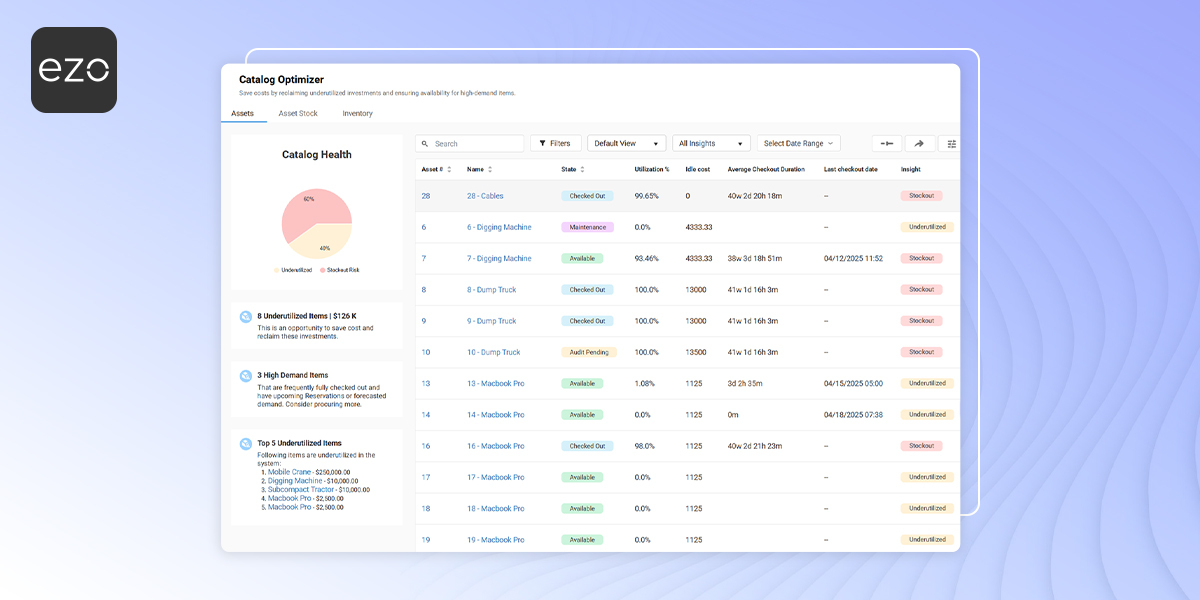
Maintaining the right quantity of assets and inventory is vital for successful business operations. Optimal stock and asset quantity prevents spending unnecessarily on resources, mitigating the risk of overstocking and understocking. Our new feature ‘Catalog Optimizer’ helps achieve just that!
Catalog Optimizer is an essential tool that provides valuable insights by utilizing assets, asset stock, and inventory data to analyze their usage and optimization trends. These insights drive demand forecasting and enable users to make informed decisions about asset procurement and allocation.
Benefits
Let’s walk you through some ways the catalog optimizer can help improve daily operations by providing in-depth insights:
1. Smarter procurement decisions
Catalog optimizer utilizes historical trends, stats on usage days, and asset availability data to identify whether the items are available in optimal quantities or not. Based on the system-generated insights, you can arrange for stockout items accordingly to avoid halts in operations.
2. Demand forecasting
You can automate the calculation of key inventory management metrics – for instance, demand forecasting. Using inventory consumption metrics, like predicted monthly consumption and expected days of stock remaining, you can analyze the future demand and consumption of inventory.
This analysis helps optimize inventory levels, reduce the need for last-minute orders and emergency sourcing – lowering associated risks and costs.
3. Actionable insights
You can identify items that are frequently out of stock or in surplus to decide how they can be utilized better. Likewise, you can conduct comparisons between similar assets and analyze their usage days and stockout days to identify more frequently used items. This analysis helps maintain the quantity of those items for smooth operations.
4. Resource optimization
Once you assess the quantity and use of inventory, you can identify and reallocate underutilized resources. Inventory that is in surplus for a long time can be evaluated to be reallocated or consumed to reduce unnecessary holding costs. By efficiently using inventory, you can significantly improve the financial health of your business.
Let’s go through the catalog optimizer workflows:
Catalog Optimizer for Assets
Some important definitions for the asset catalog:
Utilization%: Extracted from the utilization report. It works on the same formula applied to the report and calculates utilization since the creation of assets.
Utilization = Hours checked out/Total available hours.
Average checkout duration: It includes the average of total checked-out hours for all items under the grouped asset.
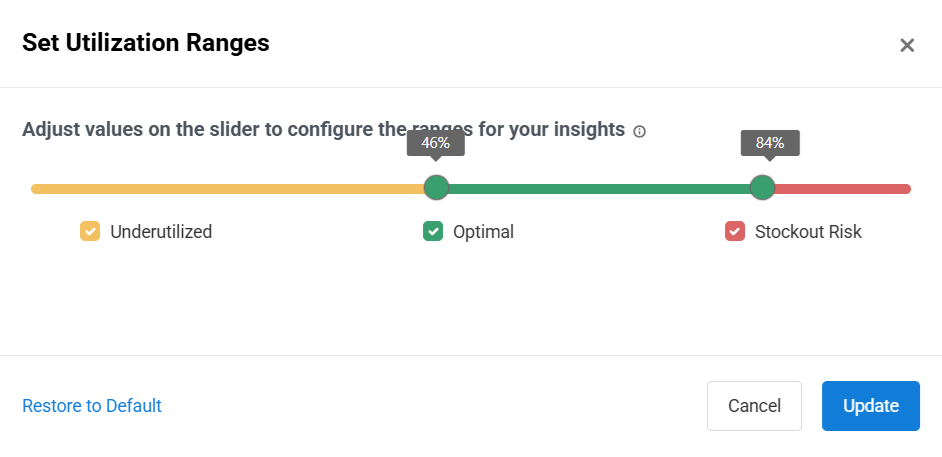
Utilization Range: This shows thresholds for catalog categories. In the image above, less than 17% utilization means underutilized assets.
Catalog optimizer for Asset Stock
Important definitions for Asset Stock:
Utilization % : Utilization% = cumulative checked out/cumulative available * 100
Total checked-out duration: no. of days (in the last 90 days) where the entire AS was checked out.
Catalog Optimizer for Inventory
Important definitions:
Predicted Consumption = (Average consumption in the last 90 days + 1 month upcoming reservations)
Inventory Gap = Net quantity – ((Reservations Planned Consumption) + (Past 03 Months Consumption Average – Past 03 Months Completed Reservations Average) + Low Stock Threshold)
Insights
- If total quantity > 2 x (Predicted consumption )+ low stock threshold = Underutilized.
- If total quantity < Predicted consumption + threshold = Stockout
- If total quantity is >= Predicted consumption + threshold and up to 2 x (Predicted consumption) + low stock threshold = Optimal
- If total quantity < low stock threshold = Stockout Critical.
Customize the Catalog Optimizer Listing
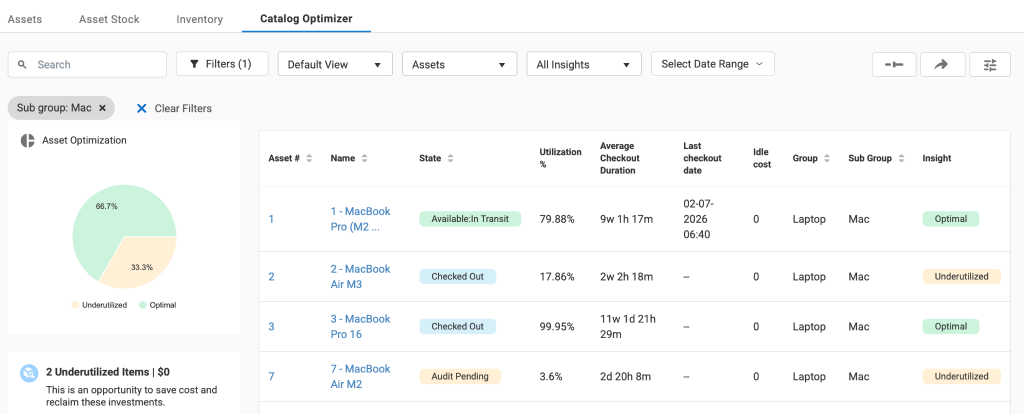
You can customize the Catalog Optimizer listing to display Group and Sub-group information directly in the list. You can also filter the listing by Sub-group to quickly find items within a specific subgroup.
Add Group and Sub-group Columns
To add these columns to the Catalog Optimizer listing:
- Open the Catalog Optimizer listing.
- Click the Column Customization icon.
- Click the + Add new column button and select Group from the available drop-down.
- Once again, click the + Add new column button and select Sub-group from the available drop-down.
- Click Update to save your changes.
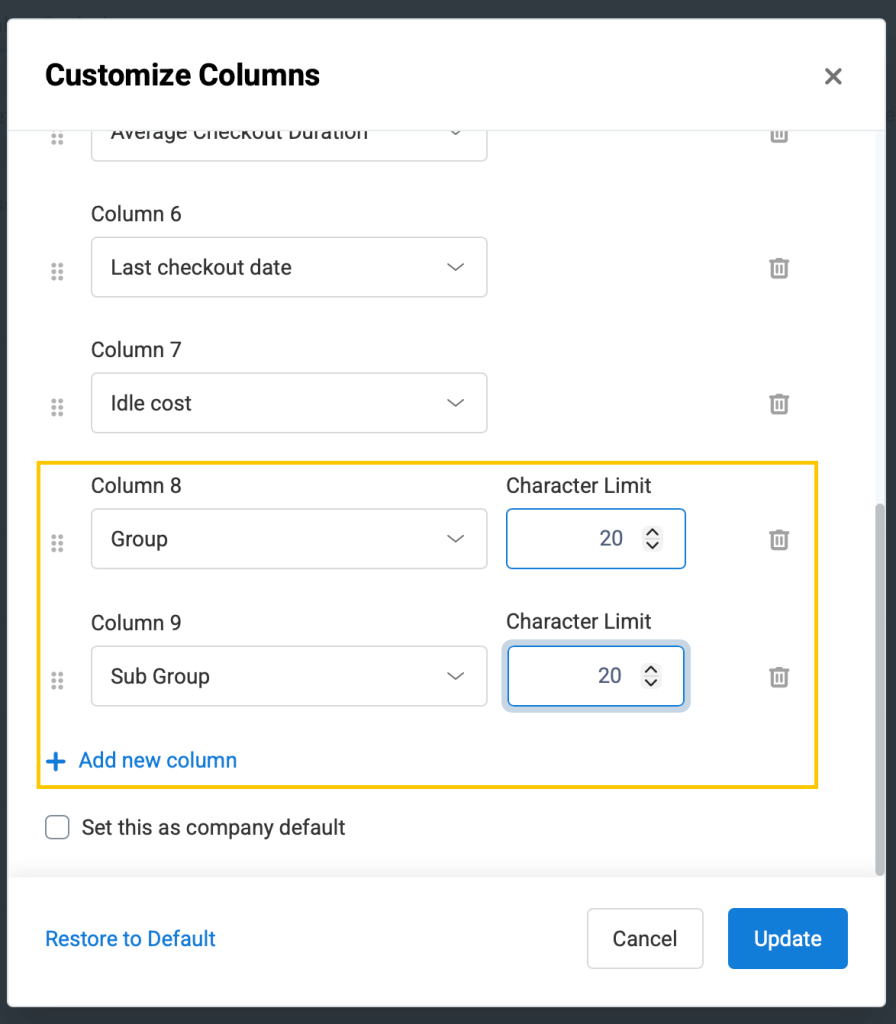
The selected columns will now appear in the Catalog Optimizer listing, making it easier to identify how items are organized.
Filter Items by Sub-group
You can also narrow down the Catalog Optimizer listing using the Sub-group filter.
- Open the Filters panel.
- In the Filter By Sub Group section, choose the subgroup you want to view.
- Click the Apply Filters button.
The listing will display only the items that belong to the selected subgroup.
Need help enabling the Catalog Optimizer for your system? Reach out to us at support@ezo.io — we’re happy to assist.

![[How-to] Automate Asset Actions in EZO](https://cdn.ezo.io/wp-content/uploads/2024/09/Automations.jpg)
![[How-to] Bolster Asset Tracking By Implementing Role Based Access For Your Business](https://cdn.ezo.io/wp-content/uploads/2021/02/EZO-role-based-access-1.png)
![[How-to] Check Out Items Faster with Quick Checkouts](https://cdn.ezo.io/wp-content/uploads/2023/09/EZOoffice-support-blog-quick-checkouts.jpg)