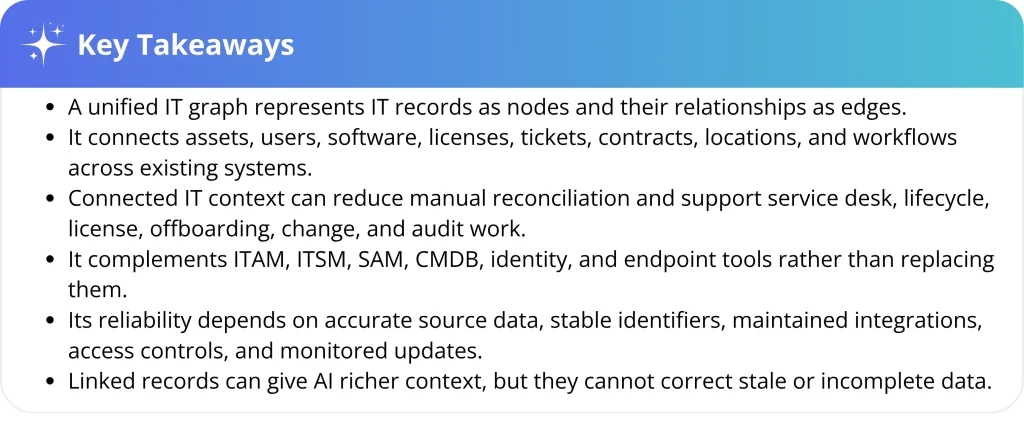
A unified IT graph is a connected model of IT assets, users, software, licenses, tickets, contracts, locations, and workflows. It shows not only what exists, but how records relate and which actions may be required next.
Here, “graph” describes records as nodes and their links as edges, such as user → device → software → license. It refers to the relationship model, not necessarily the database technology behind it.
IT teams often have plenty of data in separate systems. The harder part is linking a ticket to the affected device, its assigned user, installed software, and license or warranty context. A unified IT graph brings those records together so teams can act without rebuilding the story manually.
What a unified IT graph connects
In practice, a unified IT graph brings together the records used across daily IT operations and shows how they relate. Common record types include:
| Record type | Example context |
| Users | Department, location, assigned assets, access, tickets, approvals |
| Devices | Owner, warranty, lifecycle stage, software, incidents, location |
| Software | Installed devices, users, licenses, versions, usage, renewals |
| Licenses | Entitlements, assigned users, contracts, renewal dates, usage status |
| Tickets | User, device, issue type, priority, history, related software |
| Contracts | Vendor, software, cost center, renewal, support terms |
| Locations | Assets, users, departments, support coverage |
| Workflows | Approvals, repairs, returns, transfers, offboarding tasks |
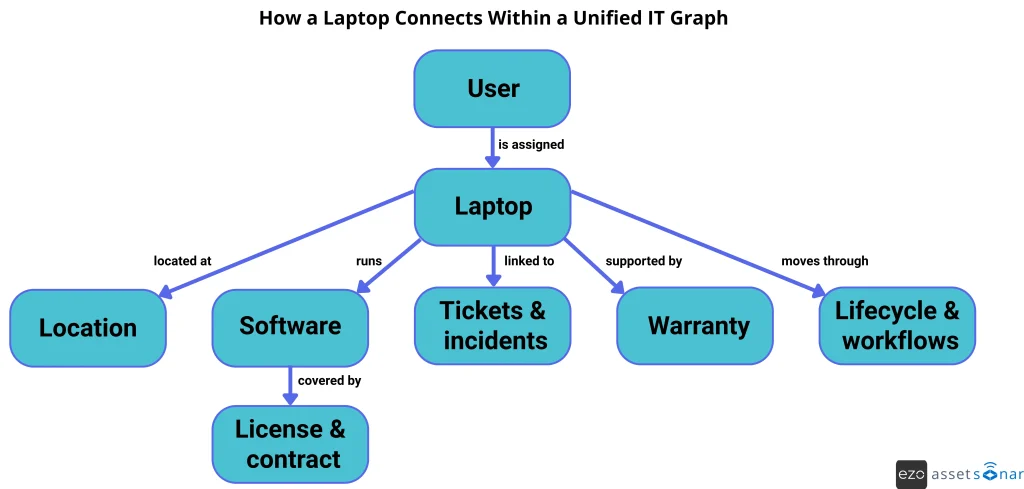
The following flowchart uses a laptop as the central node. Its links show the ownership, location, software, service, license, and lifecycle records around it.
Why IT context becomes fragmented
Modern IT asset management (ITAM), IT service management (ITSM), and software asset management (SAM) platforms, along with configuration management databases (CMDBs), can already link assets, users, tickets, software, licenses, contracts, and service dependencies to varying degrees. Fragmentation remains when these records sit across point solutions, sync at different intervals, or use inconsistent identifiers and ownership rules.
As a result, teams may still switch between tools or reconcile exports before acting. The problem is not that modern tools cannot connect data; it is that the wider IT stack may still leave operational context incomplete or inconsistent.
Single pane of glass vs. unified IT graph
A single pane of glass centralizes what teams can see. A unified IT graph maps how records relate. These approaches can overlap, but they solve different primary problems.
| Approach | Primary strength | Common limitation |
| Dashboard or single pane of glass | Brings records and metrics into one view | May display related data without modeling dependencies |
| Asset inventory | Tracks asset identity, ownership, status, and lifecycle | May not map service dependencies or cross-domain workflows |
| CMDB | Maps configuration items and service dependencies | Requires strong governance and may not include complete license or procurement context |
| Unified data platform | Supports ingestion, analytics, and AI across the business | Usually does not drive daily IT workflows |
| Unified IT graph | Maps relationships across IT operational domains | Requires integration, entity resolution, governance, and maintained source data |
The distinction becomes clearer when the same IT records are viewed before and after their relationships are mapped.
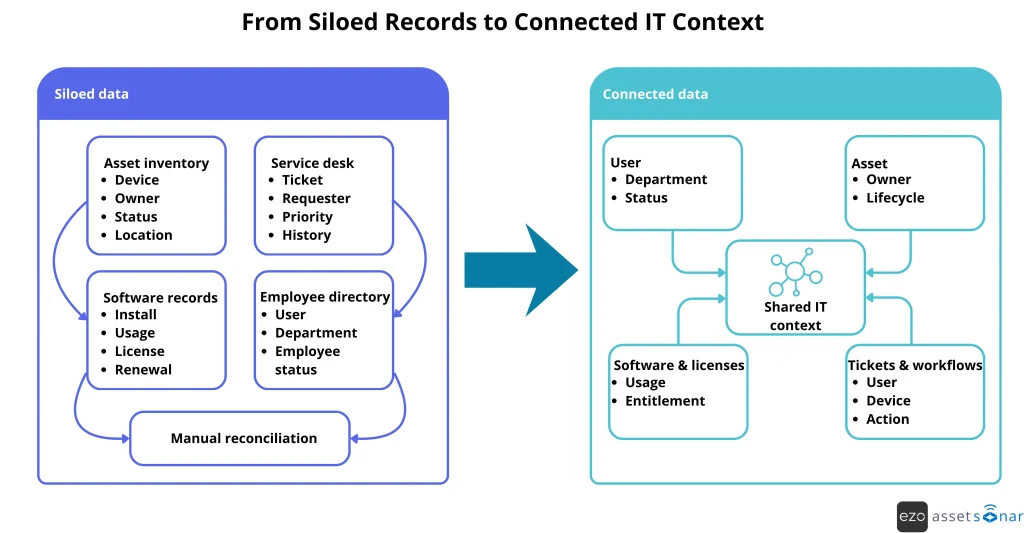
How a unified IT graph works
A unified IT graph usually works in four steps.
1. Collect source records
Connect the systems where IT work already happens, such as ITAM, ITSM, directory, endpoint management, procurement, and discovery tools.
2. Normalize and resolve entities
Match records through stable identifiers such as email, serial number, or software ID so one user or device is not represented twice.
3. Apply relationship rules
Link users, devices, software, licenses, tickets, contracts, and lifecycle events according to defined ownership and dependency rules.
4. Refresh and monitor
Use event-driven updates for fast-changing records and scheduled syncs for slower data. Monitor conflicts and failed syncs because stale relationships can create false confidence.
Where a unified IT graph adds value in IT operations
Resolve incidents and requests with asset context:
When a user reports repeated laptop crashes, the service desk can view the assigned device, incident history, installed software, warranty, and recent changes together. This reduces manual lookups and can help the agent diagnose recurring issues faster, speeding up the incident management process.
Review licenses with usage and contract context:
Linking applications to users, devices, licenses, contracts, usage, and renewal dates helps teams identify unused access and review renewals without reconciling separate spreadsheets.
Manage IT asset lifecycle decisions with current ownership:
Linked ownership, location, warranty, incident, and status records help IT decide whether an asset should be repaired, reassigned, refreshed, or retired.
Assess change impact before rollout:
Before a rollout or retirement, teams can trace the users, devices, software, services, and open tickets that may be affected. The graph supports assessing change management impact but does not replace change governance.
Recover assets and revoke access during offboarding:
A user-based view can show assigned devices, accessories, software licenses, Software as a Service (SaaS) access, open tickets, and return status. This helps teams recover assets, revoke access, and update ownership records, including for remote employees.
Build traceable audit evidence:
Linked assignment, lifecycle, software, contract, and change records can make evidence easier to retrieve and explain. The graph supports audit readiness, but compliance still depends on policies, controls, reviews, and evidence standards.
How a unified IT graph can support AI
AI tools can summarize tickets and suggest next steps, but their output is only as useful as the context available to them. A unified IT graph can connect a ticket with the affected device, its history, and the assigned user. This gives AI a stronger basis for suggesting the next action instead of relying on the ticket text alone.
The graph does not make AI automatically accurate. Stale records or missing relationships can still produce incomplete suggestions, so higher-risk actions should remain subject to human review.
What makes a unified IT graph useful?
A unified IT graph is useful only when the relationships within it are accurate, up to date, and actionable.
These areas matter most:
| Requirement | Why it matters |
| Current ownership records | Stale owner data weakens support, offboarding, recovery, and audit workflows |
| Clean software records | Duplicate or inconsistent application data can distort license reviews |
| Connected ticket history | Missing history slows diagnosis and creates repeat work |
| Reliable lifecycle status | Outdated status creates confusion around repair, redeployment, retirement, and disposal |
| Accurate location context | Missing location data makes support routing and equipment recovery harder |
| Workflow connections | Approvals, returns, repairs, and offboarding tasks need to connect back to the asset or user record |
Accuracy is only one requirement. Because the model links identity, device, software, and activity data, teams also need role-based access, source ownership, retention rules, sync monitoring, and audit logs for relationship changes.
How AssetSonar puts connected IT context into practice
The term unified IT graph describes a relationship-based view of operational IT data. Within AssetSonar, the IT Graph creates that view by linking assets, users, software, licenses, contracts, tickets, locations, and lifecycle history.
This context supports different teams in different ways:
- ITAM teams can use ownership, custody, warranty, location, and lifecycle history to guide assignment, recovery, refresh, and audit decisions.
- Service desk agents can view the affected user, device, installed software, and previous incidents while handling a ticket, reducing manual lookups.
- SAM teams can review installations and usage alongside entitlements, contracts, users, and renewal dates.
- During offboarding, IT can identify the hardware, licenses, tickets, and access actions associated with a departing employee.
The AssetSonar IT Graph does not correct inaccurate source data or replace data governance. Its usefulness still depends on maintained integrations, defined sources of truth, current records, and appropriate access controls.
A related customer example comes from Stellar. After centralizing asset data in AssetSonar and connecting it with Zendesk, the company reduced a manual inventory process from a day and a half to about 20 minutes. Device-recovery outreach fell from about three days to one.
From connected records to informed action
A unified IT graph is most valuable when it turns relationships between assets, users, software, licenses, tickets, and workflows into usable context. It does not replace ITAM, ITSM, SAM, a CMDB, or the governance that keeps those systems reliable. Instead, it helps teams use their existing records together, reducing the manual work required to understand ownership, impact, history, and next steps.
That value depends on accurate source data, maintained integrations, clear ownership rules, and appropriate access controls. When those foundations are in place, IT teams can investigate issues, coordinate lifecycle work, and make operational decisions with a more complete view of the environment.

![[How-to] Gain Clear Visibility Into Your IT Asset Dependencies With CMDB](https://cdn.ezo.io/wp-content/uploads/2022/04/20123107/Gain-Clear-Visibility-Into-Your-IT-Asset-Dependencies-With-CMDB.webp)