Key Takeaways:
- HAM, SAM, and compliance indicators need different reporting units. Devices, users, installations, and license seats cannot share one denominator.
- At fleet scale, assess coverage by operating system and location. A high overall total can conceal an entire missing endpoint group.
- Separate confirmed control failures from missing evidence. An endpoint without a reported security value still requires investigation.
- Use grouped charts for summaries and detailed reports for investigation. Validate the dashboard against a representative pilot before expanding access.
For mid-market IT teams managing thousands of endpoints, even a routine status check can mean pulling several exports. Hardware records show who has each device, software reports track licensing, and device security checks draw on separate data. Reconciling those records takes time and delays decisions about which issues to address first.
A unified IT asset dashboard can bring these answers together when the underlying records are connected. Hardware status, software licensing, and supported security indicators can appear alongside reports that identify what needs attention. An IT asset management platform provides the shared device and user context behind those views.
To help IT teams act on that information, the dashboard should show the records behind each total. Each issue should also have a clear owner.
Define what the unified dashboard will measure
HAM tracks physical devices, custody, and lifecycle state. SAM tracks software, license rights, assignments, and usage. Compliance reporting connects selected obligations or policies with evidence showing whether their conditions are met.
When building a combined IT asset dashboard, distinguish license compliance from device-security policy checks. IT asset compliance reporting supports audit preparation by identifying the requirement each result assesses. An encryption result alone does not establish compliance with every security or regulatory requirement.
Start with a defined population, such as company-managed Windows and macOS laptops. Finish with a shared view for investigating hardware, software, and policy exceptions. Keep separate detail reports for different record types.
Essential features for a HAM, SAM, and compliance dashboard
Evaluate features against the work reviewers must perform. IT asset reporting needs to preserve relationships between records while keeping each measure interpretable.
| Feature | What to check before building |
|---|---|
| Device reconciliation | Multiple discovery sources can be matched to the correct physical device. |
| Software and license relationships | Software detections, purchased rights, and assignments retain their distinct meanings. |
| Security evidence fields | The required policy checks have supported source fields for each endpoint type. |
| Saved reports and dashboard widgets | Summary charts can sit beside tables showing the records requiring action. |
| Filtering and grouping | Reviewers can isolate locations, device groups, software products, or other supported dimensions. |
| Role permissions and exports | Authorized users can investigate findings and retain the relevant reporting evidence. |
Prepare the data, permissions, and review owners
Gather the following before configuring the dashboard. Resolve access and ownership questions while the source administrators are available.
- Endpoint scope: Device classes, operating systems, business units, and lifecycle states included in the first release.
- Connected sources: Access to the relevant discovery, mobile device management (MDM), identity, and software systems. Confirm which fields each connection supplies.
- License evidence: Agreements, quantities, entitlement types, and renewal dates for the software being assessed.
- Policy definitions: Approved requirements, applicable device populations, evidence expectations, and exception owners.
- Reporting access: Permission to create and schedule reports and edit dashboards. In AssetSonar, confirm that “Custom Report” is enabled before starting.
- Review owners: An IT asset owner for hardware, a software-license owner for SAM, and a security owner for device-policy findings.
Use a pilot containing different operating systems, locations, and discovery sources. Include shared devices and remote endpoints where they exist, rather than testing only office laptops.
How to build the dashboard across hardware, software, and compliance
Use the following sequence to prepare the data and configure the combined view in AssetSonar. The platform comparison afterward covers alternative reporting approaches.
Step 1: Map each reporting question to its source and record type
Create a source map before combining totals. Record each field’s authoritative source, update schedule, and counting unit.
| Reporting question | Record type | Example evidence source |
|---|---|---|
| Which endpoints are assigned or available? | Physical device | Asset record and custody history |
| Which licenses expire this month? | Software license | License record and agreement |
| Which installations have matching entitlement? | Installation, user, or device, according to licensing rules | Software and entitlement records |
| Which applicable devices report encryption? | Device evaluated for that control | Supported endpoint security fields |
Keep identity data consistent across sources. Identity integrations help populate user records, but confirm that imported accounts map to the intended people.
If connected systems report conflicting values, ask the relevant administrator which source should supply each field. Record that decision in the dashboard specification.
Output: A source map with owners, counting units, and refresh expectations.
Step 2: Reconcile devices and check fleet coverage
Compare the reported assets against the endpoint sources in records. Investigate differences by operating system and location.
Two systems can each contain 5,000 records while listing different devices. Match records individually, especially when several connectors detect an endpoint.
AssetSonar’s hardware discovery combines agent, network, and MDM sources, then matches records by serial number, UDID, or custom rules. Review matching outcomes before charting the resulting device records.
In AssetSonar, open “Items > Assets > Overview” and review the IT Asset Accuracy indicators for outdated records, invalid serial numbers, and duplicates. These assess discovered-record quality.
Output: A reconciled population with owned investigations for unexplained gaps.
Step 3: Connect software detections with the correct license rights
Review software normalization before comparing detected applications with license records. Check that components and naming variations belong to the intended product, while preserving licensing-relevant distinctions.
In AssetSonar, open “Software > Software Licenses” and select the license. Check total seats and entitlement criteria under “Details,” then review assignments under “Entitlements.” The user-based, machine-based, or user-machine-based criteria should reflect the agreement.
For manual licenses, use “Update Entitlements” to manage license entitlements. Automatic entitlements sync from the configured source. An assignment records allocation; usage evidence records observed activity.
Check apparent shortfalls against the agreement before recommending purchases or removals. Missing entitlement records and confirmed excess consumption require different remedies.
Output: Reviewed software-to-license relationships and assigned entitlement questions.
Step 4: Build separate hardware and software reports
In AssetSonar, open “Reports” and select “Create Custom Report.” Choose the primary module, then add the required related modules, columns, and filters.
For hardware, choose “Asset” as the primary module. Include device identifiers and relevant custody details, then group counts by state or location.
For renewals, choose “Software Licenses” and include “End Date” and “Cost.” Filter “Software Licenses – End Date” to “This month” for the current month’s expirations.
Run and save each custom report. Check what each row represents before accepting grouped totals, particularly when adding related records.
Output: Saved HAM and SAM reports with confirmed counting units.
Step 5: Configure reports for supported device-security checks
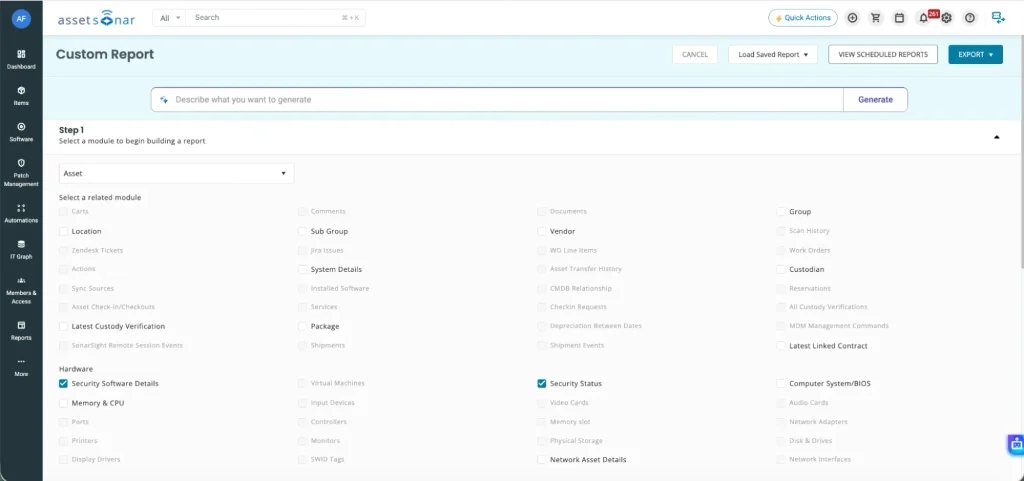
In AssetSonar, create a device-security report with “Asset” as the primary module. Under “Hardware,” select “Security Software Details” and “Security Status” as related modules. Then choose the required report columns.
Available columns include “Security Status – Encrypted,” “Security Software Details – Enabled,” and “Security Software Details – Up-to-Date.” Select relevant security indicators, apply filters, and run the report. Confirm source coverage for each operating system.
Keep device identifiers alongside the selected security fields. This makes each finding easier to trace to the affected endpoint.
Name reports after the condition assessed, such as “Devices reporting encryption disabled.” Distinguish missing evidence from confirmed failures and approved exclusions.
An illustrative fleet contains 5,000 devices subject to an encryption requirement. Of these, 4,500 report encryption, 300 report encryption disabled, and 200 lack usable evidence. Reporting 4,500 out of 4,800 evaluated devices gives 93.75%; reporting against all 5,000 gives 90%. State the denominator and unknown count beside the result.
Output: Control-specific reports with explicit applicability and unknown-result treatment.
Step 6: Assemble summaries and exception tables on one dashboard
In AssetSonar, enable “Custom Roles” if needed for role-based dashboards. Open “Dashboard > My Dashboard > Create New Dashboard” and choose the intended role.
Select “Edit Dashboard,” then use “New Header” for section headings and “Manage Widgets” for key performance indicators (KPIs). Organize the view around hardware, software, and compliance.
For charts, run the report, select “Create Graph,” configure the axes, and save the report and graph. Use “Add to Dashboard” to pin the saved output.
To pin a table, open “Edit Dashboard > Manage Widgets > Add function, table, or graph from Custom Reports.” Select the saved report, choose “Table,” and select its columns. Pair a hardware-state chart with license-expiry and security-exception tables.
For on-premises usage tracking, enable metering and deploy the ITAM Agent and Activity Tracker on supported Windows or macOS devices. Where available in the account, add “Unused Software Installations.” It shows the top 10 unused software titles by installation count for the selected period.
For thousands of endpoints, group charts by meaningful categories. AssetSonar’s custom-report graphs have a 200-entry limit, so check for truncation warnings and retain detailed reports for the full population.
Output: One combined dashboard with summaries and actionable detail.
Step 7: Apply access rules and test the reviewer experience
Review the permissions behind the role-based dashboard. The authorized reviewer role should cover the records required for investigation.
Decide who may edit the layout and reports. Test role-dependent widget visibility with a representative user.
Ask the reviewer to open a hardware exception, license report, and security finding. Correct missing access through the appropriate role or handoff.
Output: Tested viewing, investigation, and editing permissions.
Step 8: Validate the pilot and establish the reporting handoff
Run an end-to-end pilot before fleet-wide rollout. Compare dashboard values with saved reports and source evidence from the same period.
Test a device-state change, approaching license expiry, confirmed policy failure, and missing security value. Record whether each appears correctly after its source updates.
Schedule recurring reports for the responsible reviewers after the relevant source refreshes. For example, the Intune integration supports a scheduled 24-hour sync; dashboard refresh alone does not rerun that import.
Close findings only after corrected source evidence reaches the report. Retain “Item Trail” history where enabled to help investigate changes.
Output: Pilot acceptance evidence and a documented review-to-closure handoff.
Handle exceptions without losing the affected records
Some failures require a different route from routine configuration. Keep the original evidence available while the responsible owner investigates.
| Trigger | Responsible role and next action | Closure condition |
|---|---|---|
| Connector access expires | Integration administrator restores authorization and reruns the supported sync. | A successful import updates the affected records. |
| One device appears under conflicting identities | Asset administrator checks identifiers and confirms the correct record. | Device identity is resolved without losing required history. |
| Security evidence is unsupported for a device class | Security owner selects another approved evidence source or records an applicable exclusion. | An accepted evidence path or approved exclusion exists. |
| License findings conflict with an agreement | License owner reviews the entitlement model and contractual scope. | Reconciliation is corrected or a confirmed shortfall has an approved remedy. |
Keep unresolved exceptions visible with a review date. Closure requires the evidence specified above.
Correct each finding at the layer where it originates
Findings can originate in source data, business records, or report configuration. Identify the responsible layer before making corrections.
Investigate incorrect discovered attributes at the supplying endpoint or integration. Correcting that source prevents later imports from restoring the error.
For business-record changes, use the relevant hardware management or software management workflow. Custody and lifecycle updates belong with the asset; entitlement questions belong with the license and agreement.
Correct reporting filters without changing accurate source records. Route encryption remediation to the authorized endpoint administrator, and verify supported actions before automating them.
Platform comparison for a unified IT asset dashboard
Compare platforms using the same hardware, software, and policy exceptions. Check their investigation paths, evidence outputs, and configuration dependencies.
| Platform | Dashboard approach | Evidence and investigation | Setup dependency |
|---|---|---|---|
| AssetSonar | KPI cards plus custom-report graphs and tables | Related asset, software, license, and security reports | Enable reporting and required account capabilities |
| ServiceNow ITAM | Asset Management Executive Dashboard | Aggregate widgets lead to underlying list views | Activated HAM/SAM applications and appropriate roles |
| InvGate Asset Management | Custom charts and Software Compliance views | Contracts, assignments, availability, and usage context | Applicable subscription capabilities and metering configuration |
| Freshservice | Multi-widget Analytics reports | Underlying data, software-installation associations, and exports | Analytics permissions and applicable reporting plan |
AssetSonar: Configure a dashboard around connected IT asset records
AssetSonar’s license management connects software installations and entitlements for investigation. Open “Software > Software Licenses > Overview” for seat availability, annualized spend, and license-usage categories.
This fits mid-market IT teams using device and software records within one ITAM environment. The “License Usage” chart distinguishes “Used Seats,” “Unused Seats,” and “Unknown.” Use this breakdown to prioritize license reviews before renewal.
ServiceNow ITAM: Combine application KPIs in an executive workspace
ServiceNow ITAM offers an Asset Management Executive Dashboard spanning installed asset-management applications. Reviewers can inspect missing hardware, expiring contracts, and software true-up costs, then select widgets to open underlying lists.
It fits existing ServiceNow HAM and SAM environments. Widgets depend on activated applications and the reviewer’s role. Daily aggregate updates can differ from newer list data.
InvGate Asset Management: Review software findings against contracts
InvGate Asset Management connects discovered assets with contract and software information. Its Software Compliance module combines contract records and metering data to show licensing exceptions, low usage, available licenses, and costs.
IT teams can chart hardware and software availability, then review contracts. Confirm subscription eligibility and metering configuration before relying on compliance and usage views.
Freshservice: Assemble an operational view within Analytics
Freshservice supports Analytics reports assembled from widgets, with underlying data, exports, and scheduled distribution. Software reporting includes installs, users, contract coverage, and software associations within asset reports.
It fits IT teams using an existing service-management workflow. Analytics remains separate from the standard dashboard. Custom report creation requires Pro or Enterprise; cross-module filters include only shared fields.
Best practices for maintaining the dashboard at scale
After rollout, manage changes to the reporting system itself. These controls help preserve comparability as the device fleet and software portfolio grow.
- Version reporting definitions. Record changes to filters, populations, and licensing assumptions before comparing reporting periods. A definition change should not appear as operational improvement.
- Measure correction throughput. Track whether new exceptions arrive faster than owners resolve them. A shrinking backlog can still conceal old findings that never receive attention.
- Separate metric ownership from report administration. The policy owner approves the meaning of a result. The administrator maintains its configuration and distribution.
- Review scheduled-report changes. In AssetSonar, edits to saved custom reports flow through to their scheduled versions. Assess recipient impact before changing columns or scope.
- Reassess views after organizational changes. Acquisitions, new device classes, and identity-domain changes can introduce data that existing filters omit. Use those events to trigger a scope review.
Maintain an approved reporting specification. It gives incoming administrators a reference for future changes.
Confirm the dashboard is ready for operational use
Use evidence from the pilot to approve release. The checklist should demonstrate behavior, rather than record that configuration tasks were attempted.
| Acceptance check | Evidence to retain |
|---|---|
| Device data accounted for | Source reconciliation with explained differences |
| Counting units correct | Sample report rows matched to displayed totals |
| Policy results interpretable | Tested failure, unknown, and exclusion cases |
| Reviewer can investigate | Permission test for all three reporting areas |
| Updates reach the dashboard | Source-to-report pilot results and timing |
| Follow-up is operational | Assigned findings, review schedule, and closure evidence |
Use the combined dashboard to guide the next decision
Once the dashboard is operational, use the first reporting cycle to identify where IT teams should focus next. Review recurring exceptions and investigate the records behind them before adding new metrics. Prioritize reporting improvements that address a specific operational question or support a recurring decision.
Renewal disputes may justify deeper analysis of license assignments and usage, while unexplained device gaps may require additional discovery sources. Repeated security exceptions may also indicate missing evidence or unresolved policy failures. Assign each new measure an owner and an acceptance test to confirm its accuracy and usefulness as reporting needs evolve.